Ticker
Use standard symbols such as AAPL, TSLA, NVDA, MSFT, or AMZN. Keep broker-specific suffixes out of the ticker when possible.
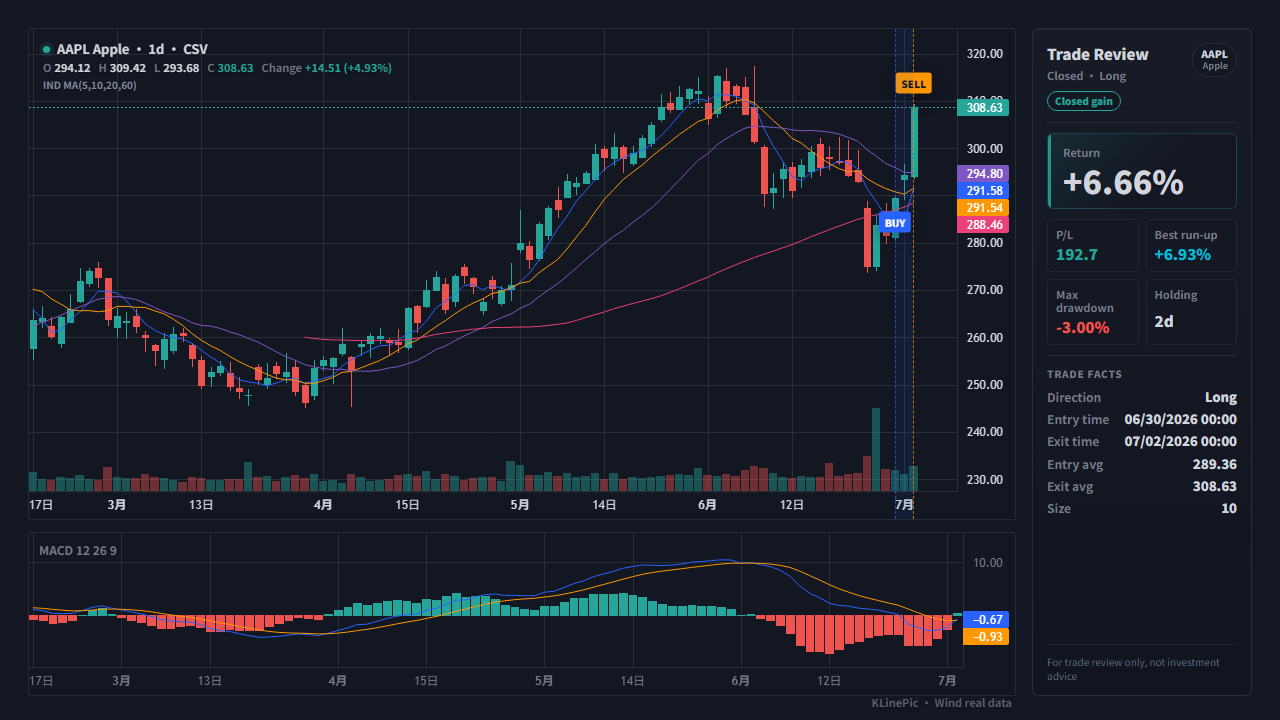
US stock trading journal chart
KLinePic converts US stock trading journals, broker fills, or mapped CSV rows into K-line review images with buy/sell markers, holding window, return, drawdown, and indicator context.
Use standard symbols such as AAPL, TSLA, NVDA, MSFT, or AMZN. Keep broker-specific suffixes out of the ticker when possible.
Include a timestamp and timezone offset, for example 2026-06-10T14:30:00-04:00, so markers align to US market candles.
Keep side, price, quantity, fees, and currency. One stable trade_id keeps partial entries and exits on the same chart.
A minimal US stock trading journal CSV can use this shape:
trade_id,symbol,event_type,position_side,time,price,quantity,fee,currency
US-AAPL-001,AAPL,buy,long,2026-06-10T14:30:00-04:00,198.40,25,0,USD
US-AAPL-001,AAPL,sell,long,2026-06-12T15:45:00-04:00,205.65,25,0,USD
This page targets concrete searches such as “US stock trading journal chart”, “AAPL trade review chart”, “TSLA entry exit chart”, and “美股交易日记 K 线图”.
Yes. Use ticker, fill time, side, price, and quantity. KLinePic matches the rows with US stock K-line data and renders entry, exit, return, drawdown, and indicator context.
Timezone is strongly recommended. US equities trade in New York market hours, so explicit offsets help keep markers aligned with the correct candle.