All examples
InputTicker + fills
Market dataUS daily or intraday
OutputJournal PNG
US stock journal
US StocksTurn AAPL, TSLA, and NVDA trade logs into review charts
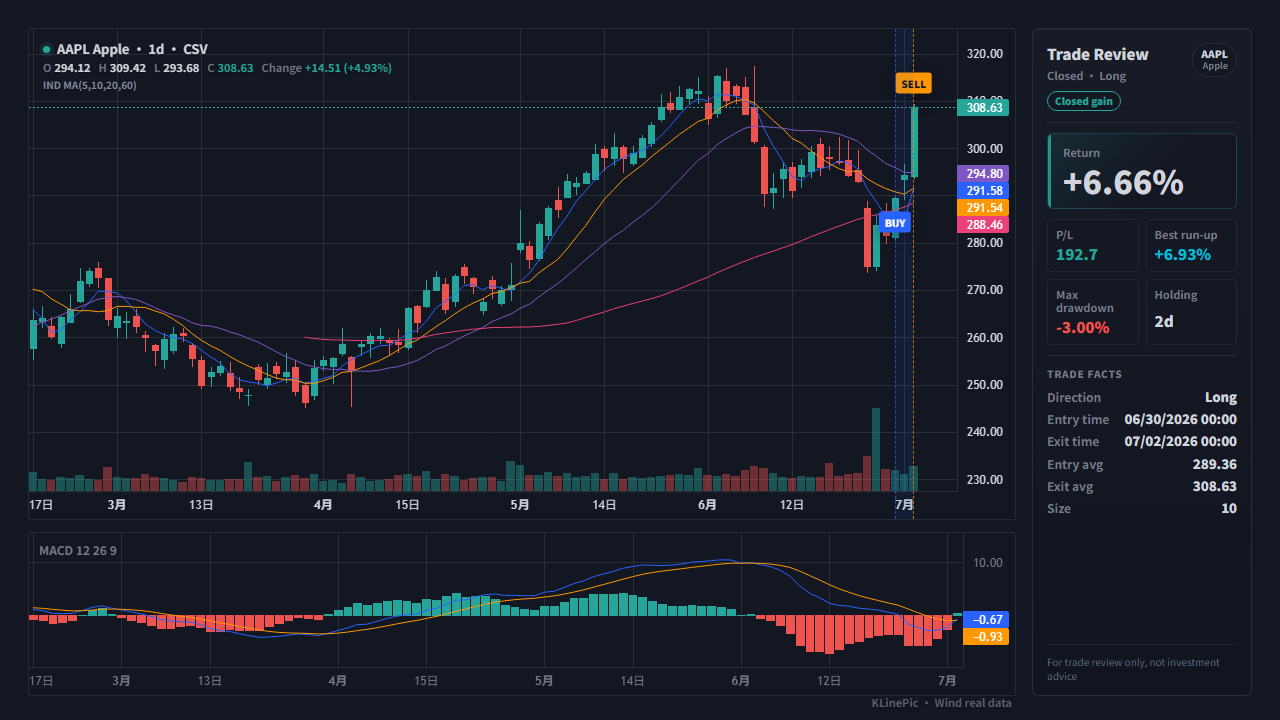
KLinePic matches ticker, time, side, and price against US stock market data so a journal table becomes a chart that can be inspected.
Best for
- US stock journal users
- Broker fill exports
- Reviewing single-stock entries and exits
Input notes
- Use standard tickers such as AAPL, TSLA, or NVDA
- Include timezone when possible
- Use actual filled price and quantity
Chart output
- The top-left header shows symbol, period, and MA setup
- The side panel groups return and holding details
- Images are ready for journal or research notes
Workflow
From file to review chart
Prepare fills
Map broker fills or journal rows into the template fields.
Match market data
Choose the US stock market route and default Yahoo source.
Export chart
Generate a high-resolution review image.
FAQ
Questions this workflow answers
Can a US stock trading journal become an annotated chart?
Yes. KLinePic uses ticker, fill time, side, price, and quantity to render AAPL, TSLA, NVDA, and other US stock trades as journal-ready review charts.
Should US stock fills include timezone information?
Yes. Timezone data helps align pre-market, regular-session, and after-hours trades with the correct chart window.
Which long-tail searches does this page target?
US stock trading journal chart, AAPL trade review chart, stock entry exit chart, and broker fills to chart.
Other chart workflows
Public workflows with real examples
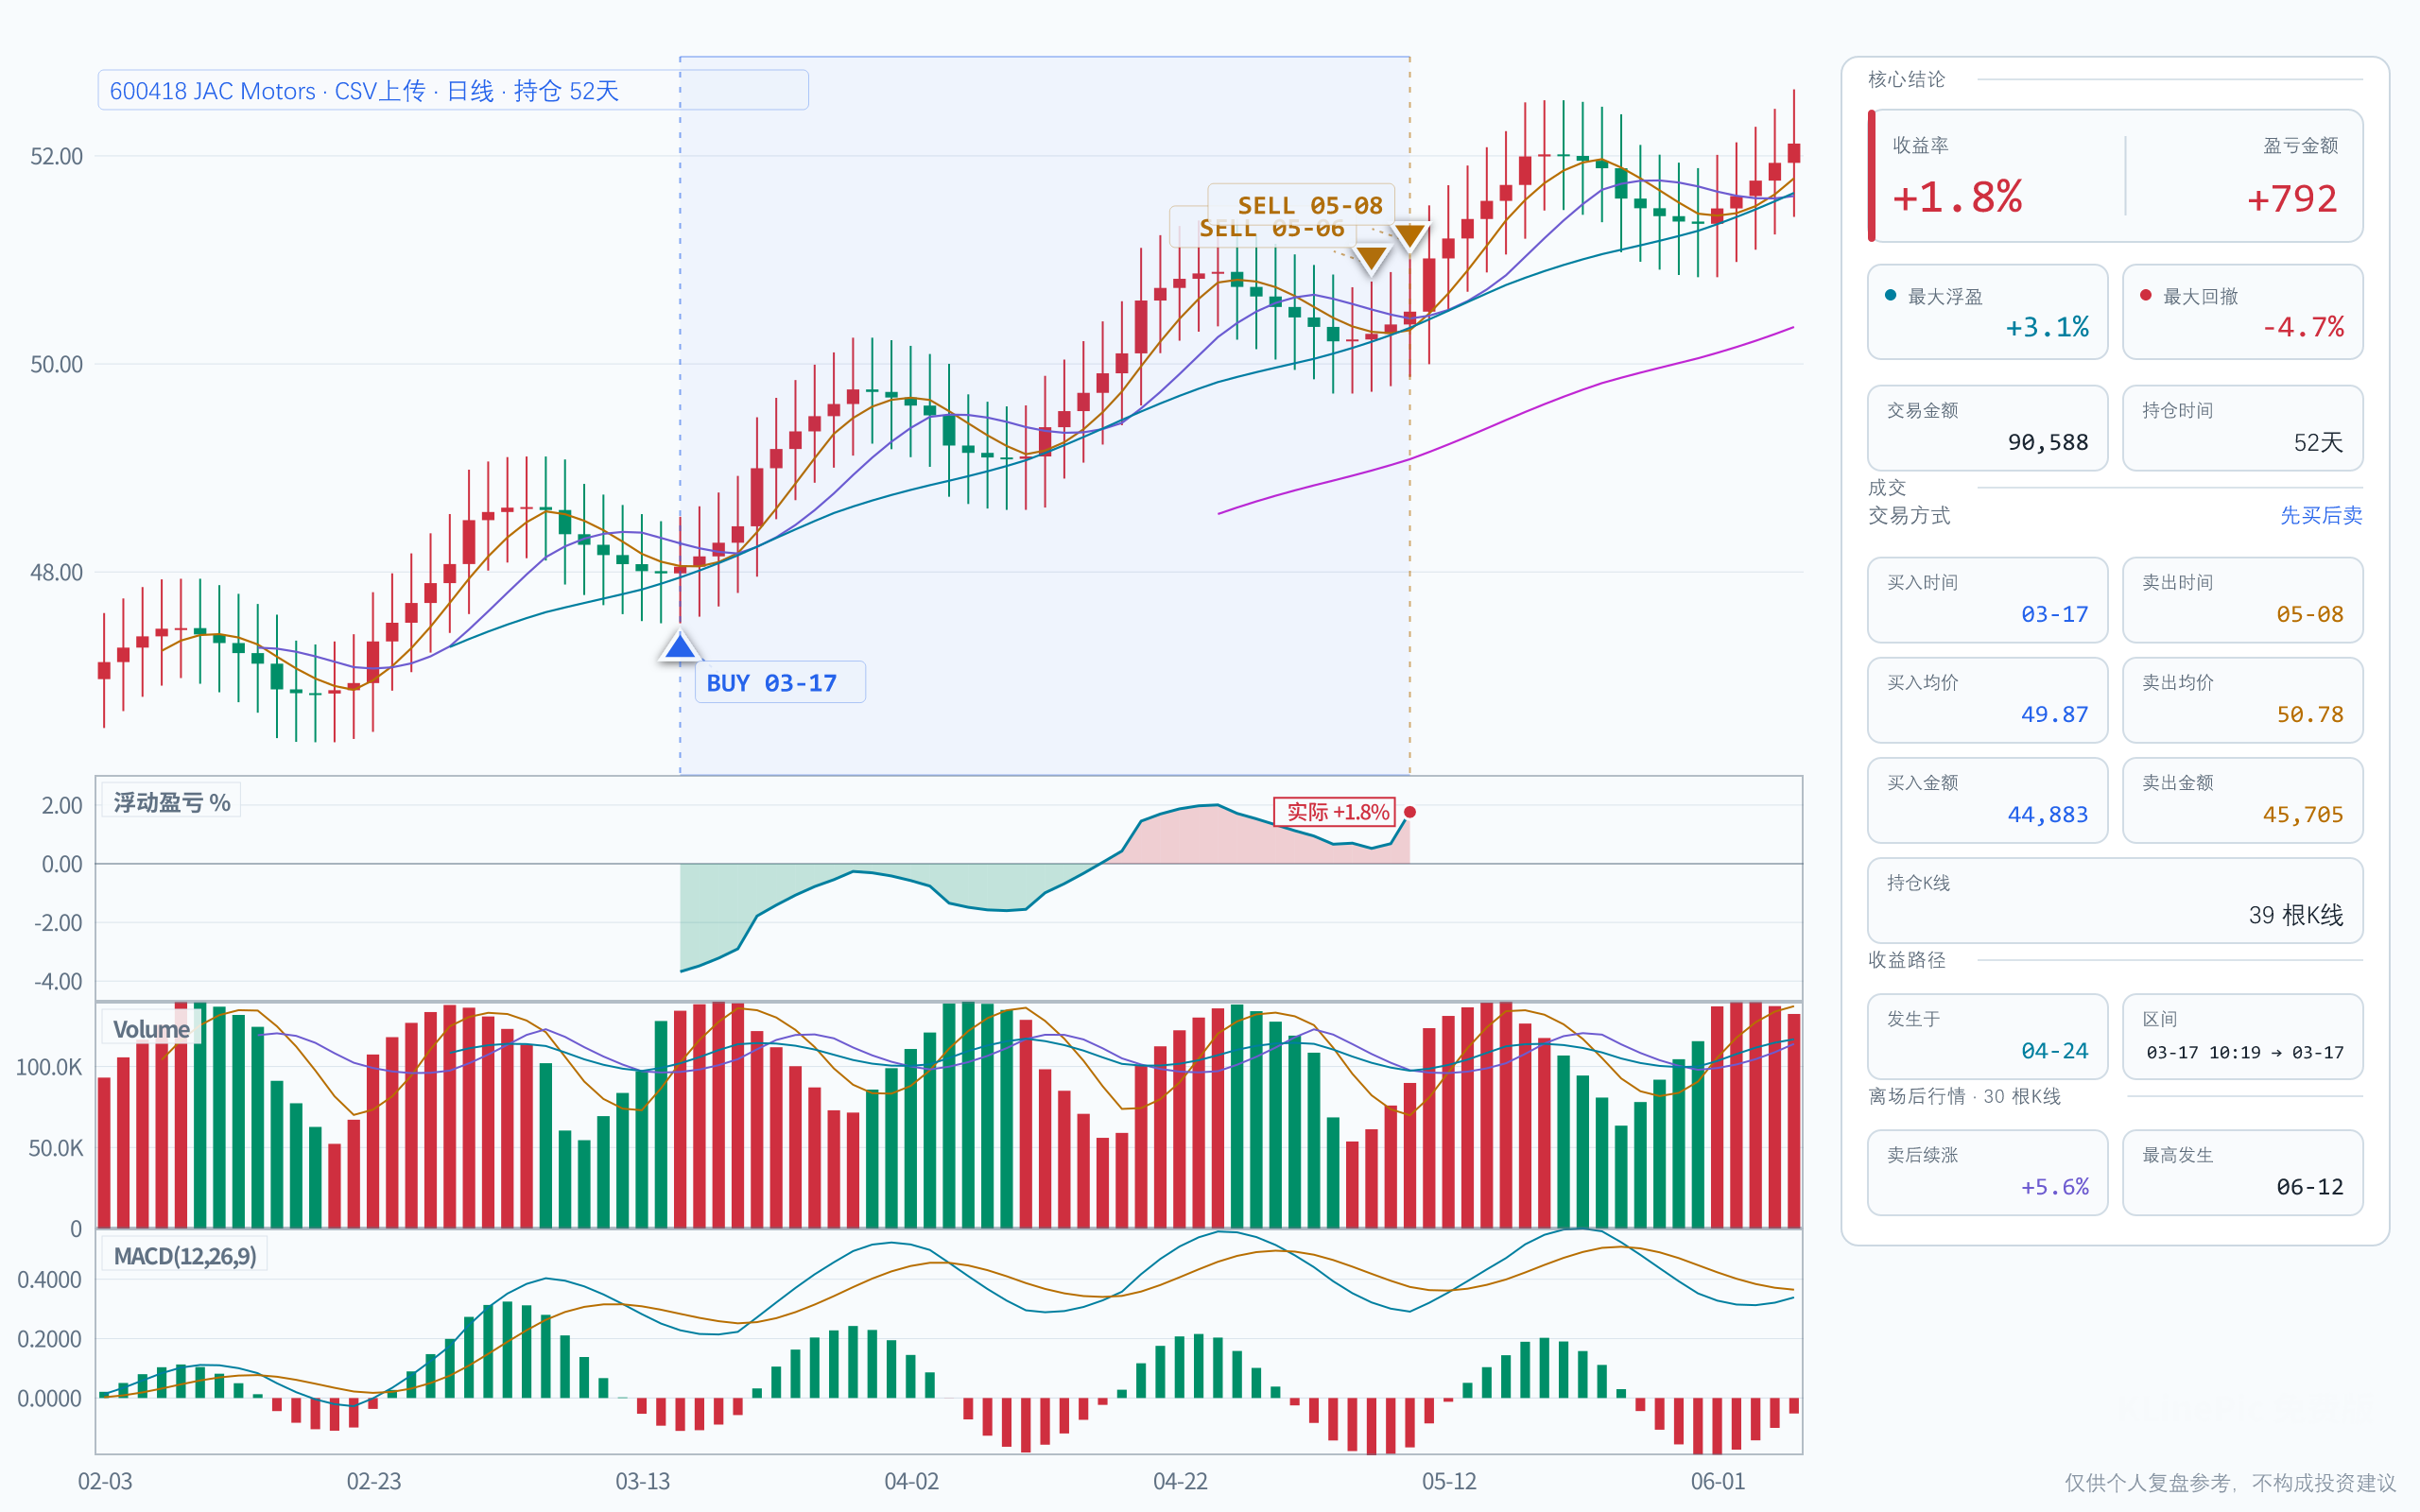 Broker CSV
Broker CSV review
A landing page for broker CSV, Tonghuashun exports, and text .xls trade statements.
Open workflow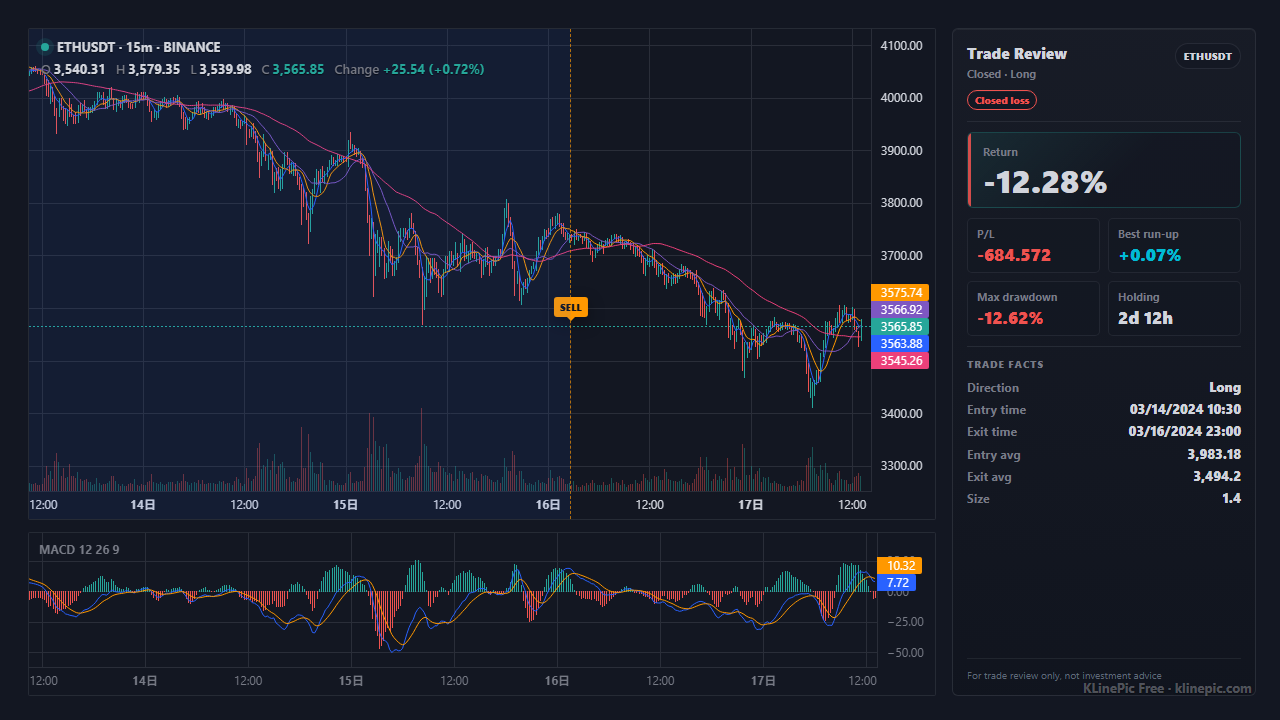 Binance
Binance review chart
For Binance spot or futures fills that need entry, exit, and P/L range charts.
Open workflow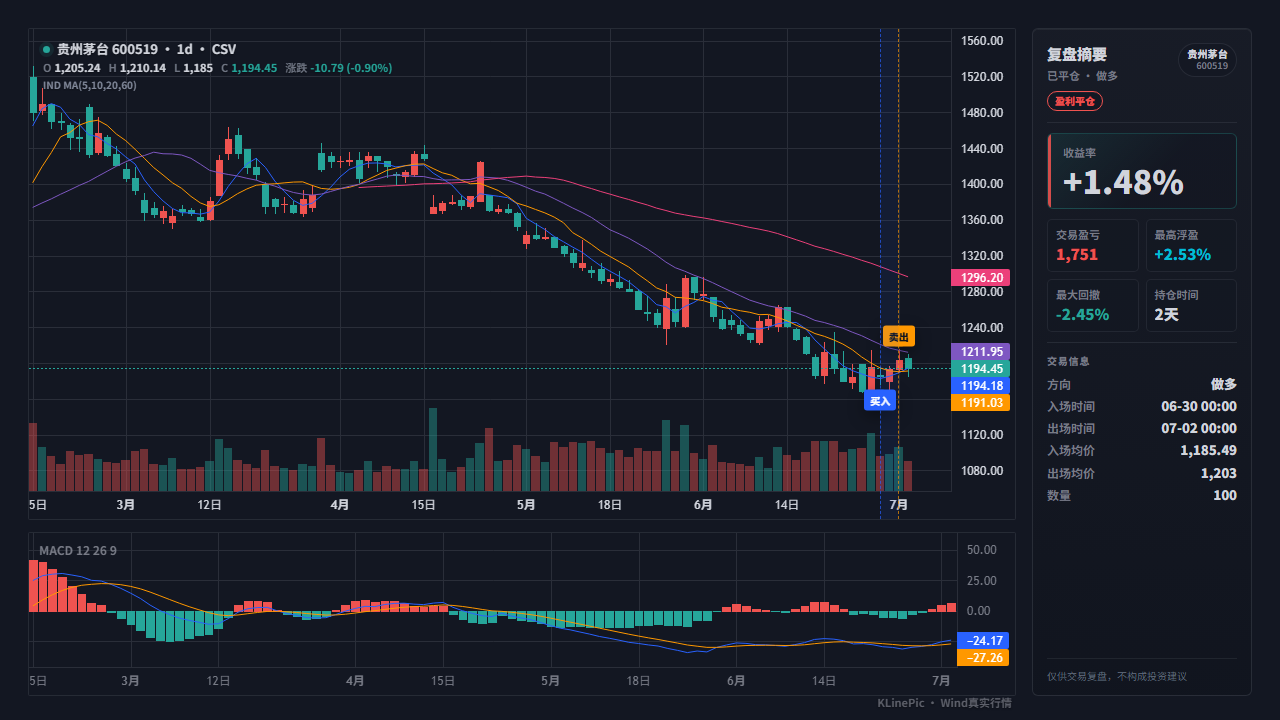 A-share
A-share review chart
For A-share stock trades, broker statements, and strategy backtest fills.
Open workflow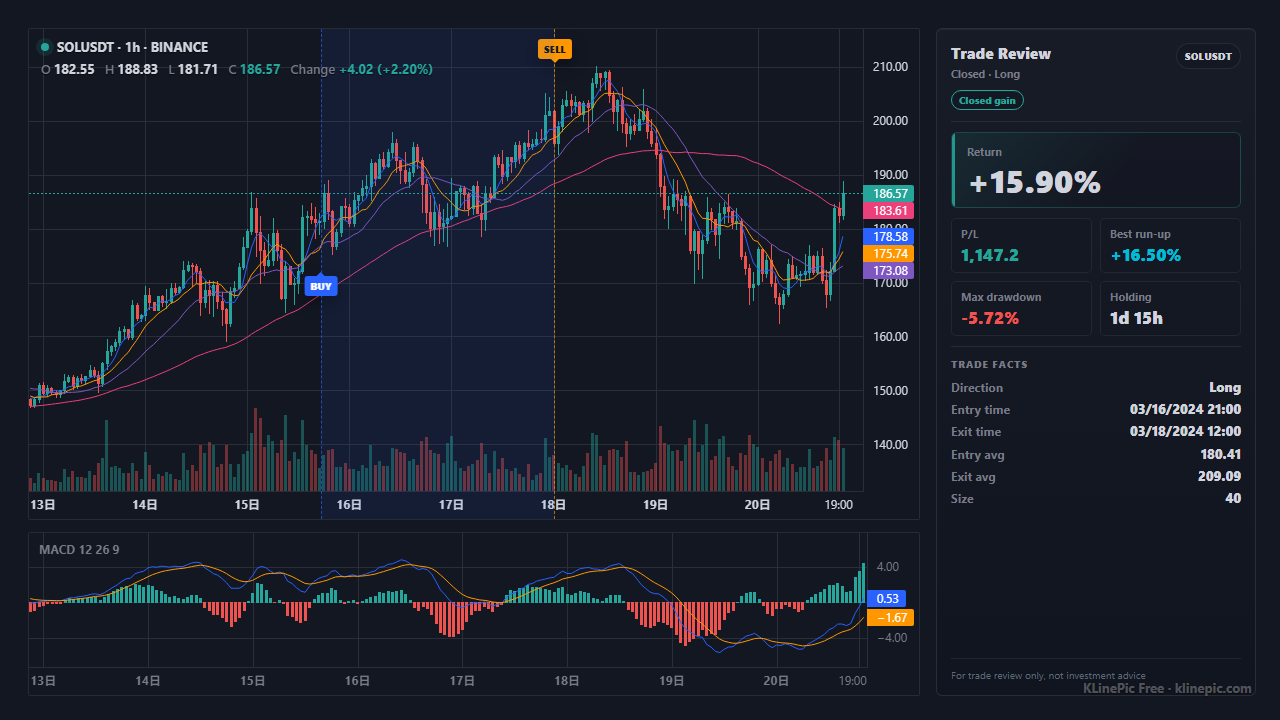 API
API
Agent API charts
For automated workflows, trading bots, research assistants, and content pipelines.
Open workflow