KKLinePic

BNBUSDT trade review chart

Turn your BNBUSDT trades into a K-line review chart.

This page is for BNB (BNBUSDT) traders on Binance who want their real fills on the chart instead of buried in the Orders table. Export your BNBUSDT trade history, map the fill rows into KLinePic's CSV schema, and render a shareable review image with entry/exit (B/S) markers, holding window, return, max run-up, and max drawdown.

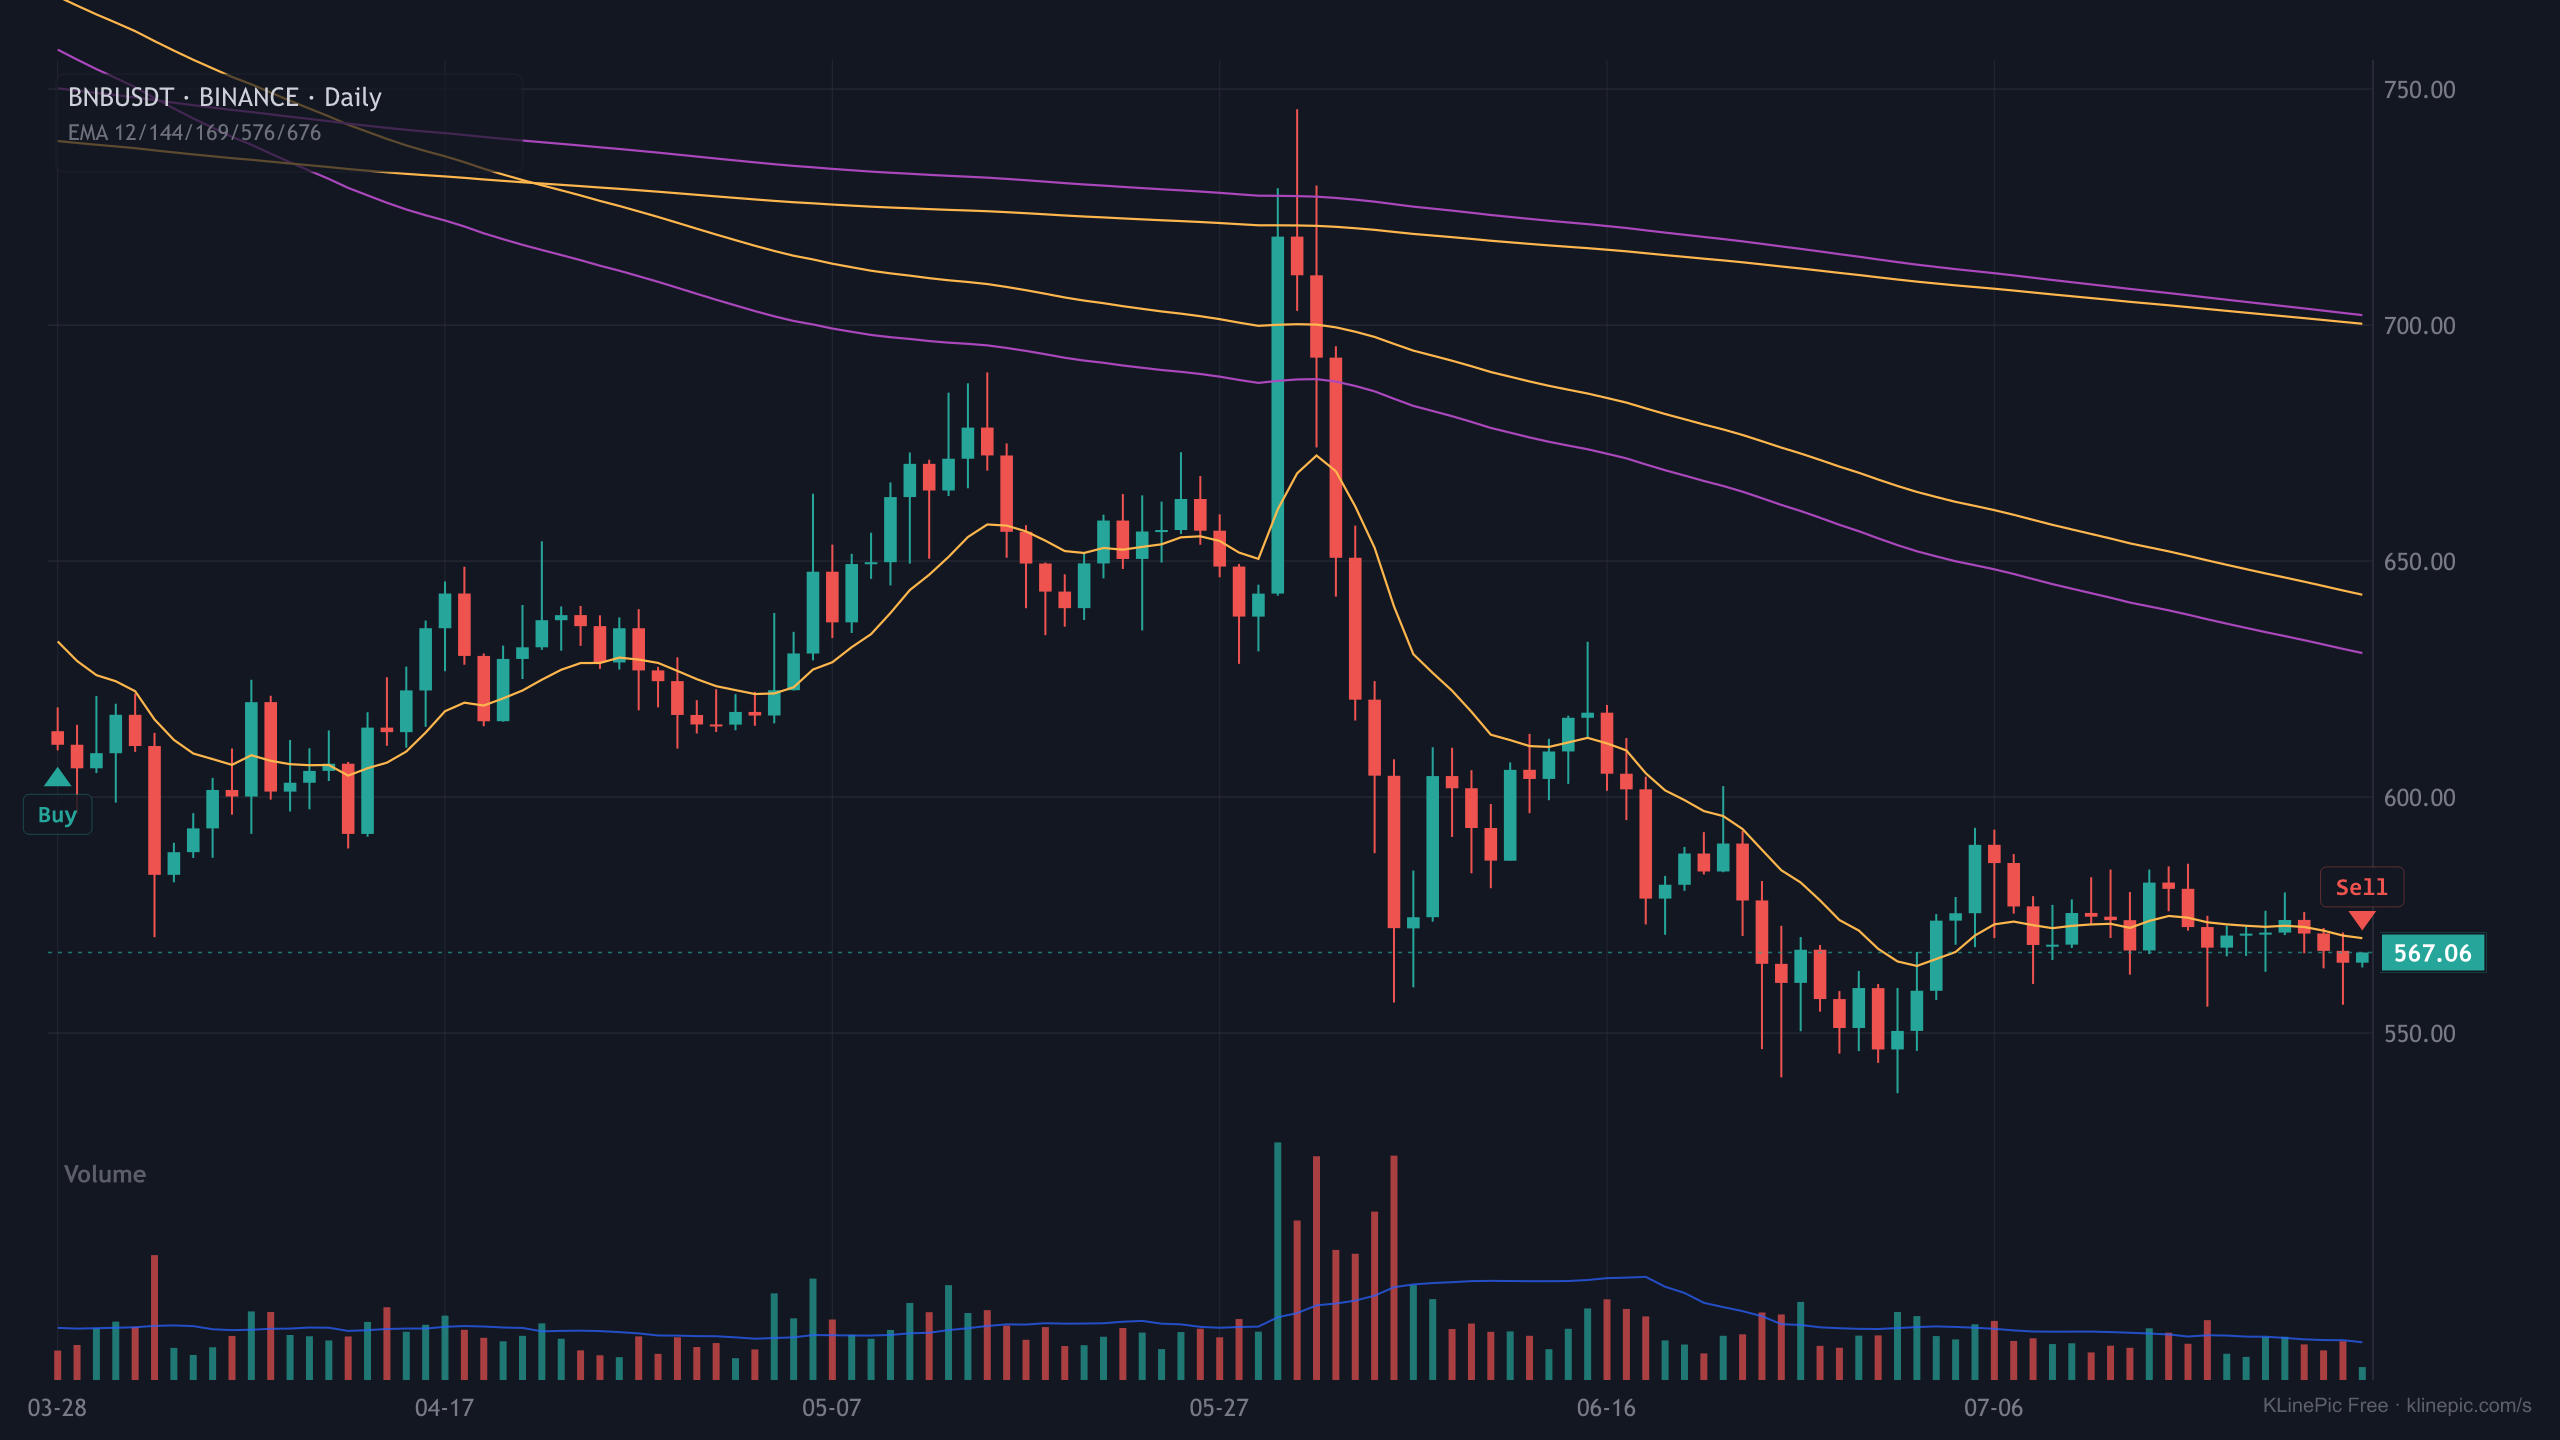
BNBUSDT trade review chart with buy and sell markers on a daily K-line
BNBUSDT daily K-line from Binance public market data, snapshot as of 2026-07-25 (2026-03-28 → 2026-07-25, 120 bars). The B/S markers show the sample round-trip below; your uploaded fills replace them with your own.

How to get BNBUSDT fills from Binance

Binance exports spot and futures history separately. Follow the official help articles for spot trade history and USDⓈ-M / COIN-M futures order history.

  1. Spot BNBUSDT fills: Orders > Spot Order > Trade History > Export Trade History. A statement covers up to a year from a chosen date; download promptly (the link is stored seven days).
  2. Futures BNBUSDT fills: Orders > USDⓈ-M Futures Order > Order History, then the Export icon. Keep executed fills only — drop canceled or unfilled orders.
  3. Binance shows spot history in UTC+0; keep that in mind when you write timestamps.

For the full walkthrough see the Binance trade history chart guide.

Map your BNBUSDT export to KLinePic fields

KLinePic reads a fixed schema: trade_id, symbol, event_type, position_side, time, price, quantity, fee, note (see the data protocol). Extra columns are ignored on import and listed back to you.

KLinePic fieldYour Binance export columnNotes
trade_idUsually none — create your ownOne stable id per round-trip trade; entry and exit fills share it.
symbolPair / market columnUse BNBUSDT exactly so markers land on the matching K-line.
event_typeSide / direction columnNormalize to lowercase buy or sell.
position_sideFutures direction column, if presentSpot can default to long; hedge-mode futures need explicit long / short.
timeFill / trade time columnBinance spot history is UTC+0; write explicit offsets like +00:00.
priceExecuted price columnUse the executed fill price, not the order's limit price.
quantityExecuted base amountBase units of BNB, not the USDT quote total.
feeFee amount columnOptional, but useful for honest net-return journaling.
noteFee currency columnOptional free text such as fee_asset=USDT.

Target CSV shape for BNBUSDT

A complete BNBUSDT round-trip — one buy, one sell, same trade_id — looks like this after mapping. The prices below are the real 120-day window low and high for illustration:

trade_id,symbol,event_type,position_side,time,price,quantity,fee,note
BNB-001,BNBUSDT,buy,long,2026-03-28T00:00:00+00:00,611.08,4.91,3.0004,fee_asset=USDT
BNB-001,BNBUSDT,sell,long,2026-07-25T23:59:00+00:00,567.06,4.91,2.7843,fee_asset=USDT

Scaling in or out simply adds more rows with the same id. The crypto template ships this exact header.

BNBUSDT facts

FieldValue
MarketCrypto · Binance spot / USDⓈ-M futures
Symbol formatTrading pair, e.g. BNBUSDT
Resolved instrumentBNBUSDT (Binance)
TimezoneUTC+00:00
Date-only buy / sell time00:00:00 / 23:59:00
Window (120 daily bars)2026-03-28 → 2026-07-25
Window range (low–high)537.25 – 745.74 USDT
Last close · window change (as of 2026-07-25)567.06 USDT · -7.20%

BNBUSDT trading profile (2026-03-28 → 2026-07-25)

Why this matters for a review chart: volatility and daily range decide how much room the BNBUSDT candles need before your buy and sell markers stop overlapping, and the exchange filters below are exactly the precision your CSV has to respect — a quantity that is not a multiple of the step size is a fill Binance never actually gave you.

Metric (120 daily bars)Value
Annualised realised volatility39.3%
Average daily range (high→low)3.09%
Days that closed beyond ±5%4 of 120 (3.4%)
Deepest drawdown inside the window-24%
Best single day+11.76% on 2026-05-30
Worst single day-6.12% on 2026-06-02
Price tick size0.01 — the smallest price increment your price column can carry
Quantity step size0.001 — your quantity column must be a multiple of this
Minimum order value5 USDT

FAQ

How volatile is BNBUSDT, and does that change how I read the review chart?

Over the 120 daily bars to 2026-07-25, BNBUSDT ran about 39.3% annualised realised volatility with an average daily high-to-low range of 3.09%, and 4 days closed beyond ±5%. The deepest drawdown inside that window was -24%. The wider the daily range, the further apart your entry and exit markers sit, so a review chart for BNBUSDT usually reads best over a window that contains the whole holding period rather than a few sessions.

What price and quantity precision does BNBUSDT need in the CSV?

Binance enforces a 0.01 price tick and a 0.001 quantity step on BNBUSDT, with a 5 USDT minimum order value. Keep your price and quantity columns at that precision: rounding a BNBUSDT fill to a coarser number silently moves the marker off the price it actually filled at.

How do I turn my BNBUSDT trades into a chart?

Export your BNBUSDT fills from Binance, map them into KLinePic's CSV fields (trade_id, symbol, event_type, position_side, time, price, quantity, fee, note), then upload or paste the CSV to render. No account is needed.

Does this work for BNBUSDT futures as well as spot?

Yes. USDⓈ-M BNBUSDT fills render the same way as spot once each row has symbol, side, time, price, and size. Futures history is a separate Binance export, and derivatives rows should carry an explicit position_side.

What time zone should BNBUSDT timestamps use?

Binance shows spot trade history in UTC+0. Write that into the time column as an explicit offset such as 2026-03-28T00:00:00+00:00 so markers land on the correct BNBUSDT candles.

Is the BNBUSDT chart on this page real market data?

Yes. The preview is a BNBUSDT daily K-line from Binance public market data over 2026-03-28 to 2026-07-25 (120 bars), window range 537.25–745.74 USDT. It is a static snapshot generated on 2026-07-25, not a live quote. Your uploaded fills replace the sample buy/sell markers with your own.

Do I need a Binance API key to chart BNBUSDT?

No. The statement download is enough; KLinePic renders from an uploaded or pasted file. For automation there is a documented Agent API and a CSV/JSON data protocol.

Can I render many BNBUSDT trades at once?

Yes. Batch rendering is supported, so a month of BNBUSDT trades becomes a full set of review images in one pass, via the web UI or the documented Agent API.

Related review charts