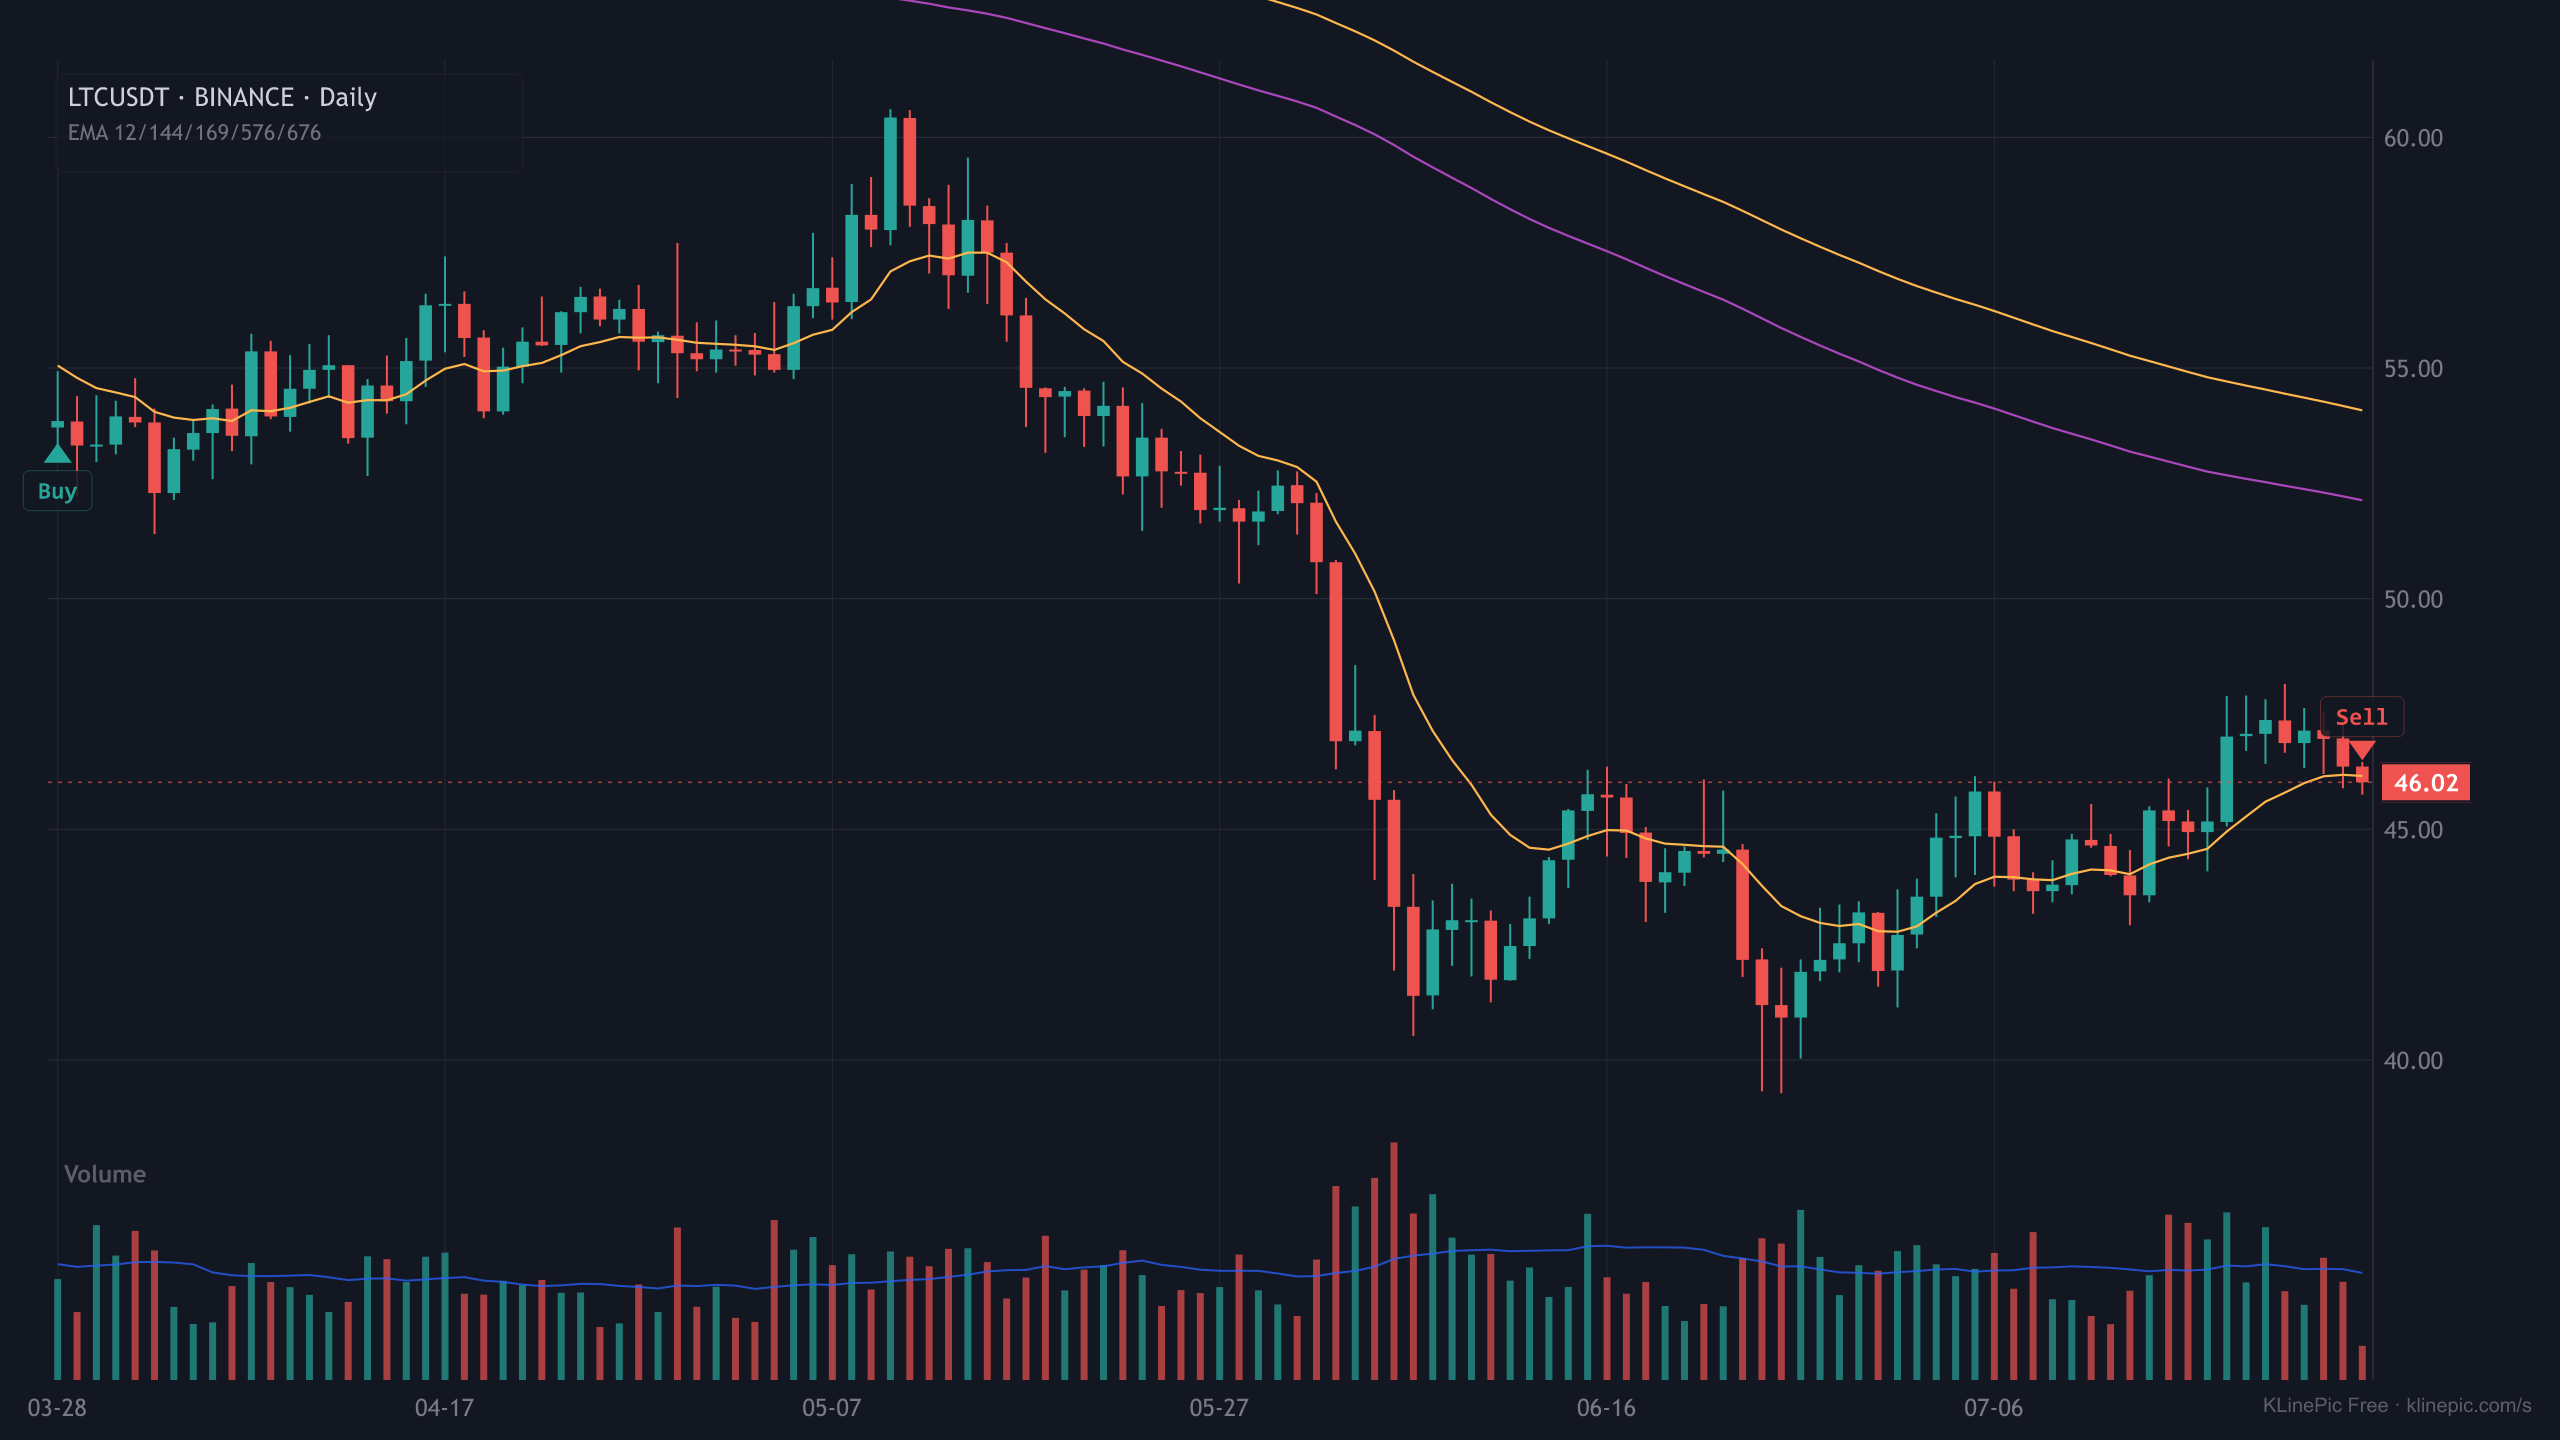
How volatile is LTCUSDT, and does that change how I read the review chart?
Over the 120 daily bars to 2026-07-25, LTCUSDT ran about 38.2% annualised realised volatility with an average daily high-to-low range of 3.53%, and 3 days closed beyond ±5%. The deepest drawdown inside that window was -32.3%. The wider the daily range, the further apart your entry and exit markers sit, so a review chart for LTCUSDT usually reads best over a window that contains the whole holding period rather than a few sessions.