Brokerage websites & apps
Look for History, Activity, Statements, or Transaction History and export CSV where offered. Monthly PDF statements still work — retype the few trade rows you need.
Contract note trade review chart
For traders whose records live in broker paperwork — contract notes, trade confirmations, execution reports, A-share 交割单 and 成交记录, Japanese 取引履歴 and 約定履歴, Korean 거래내역 and 체결내역. Map the fills onto a small CSV and KLinePic renders a review image with buy/sell markers, holding window, return, max run-up, and max drawdown — no manual charting, no account required to start.
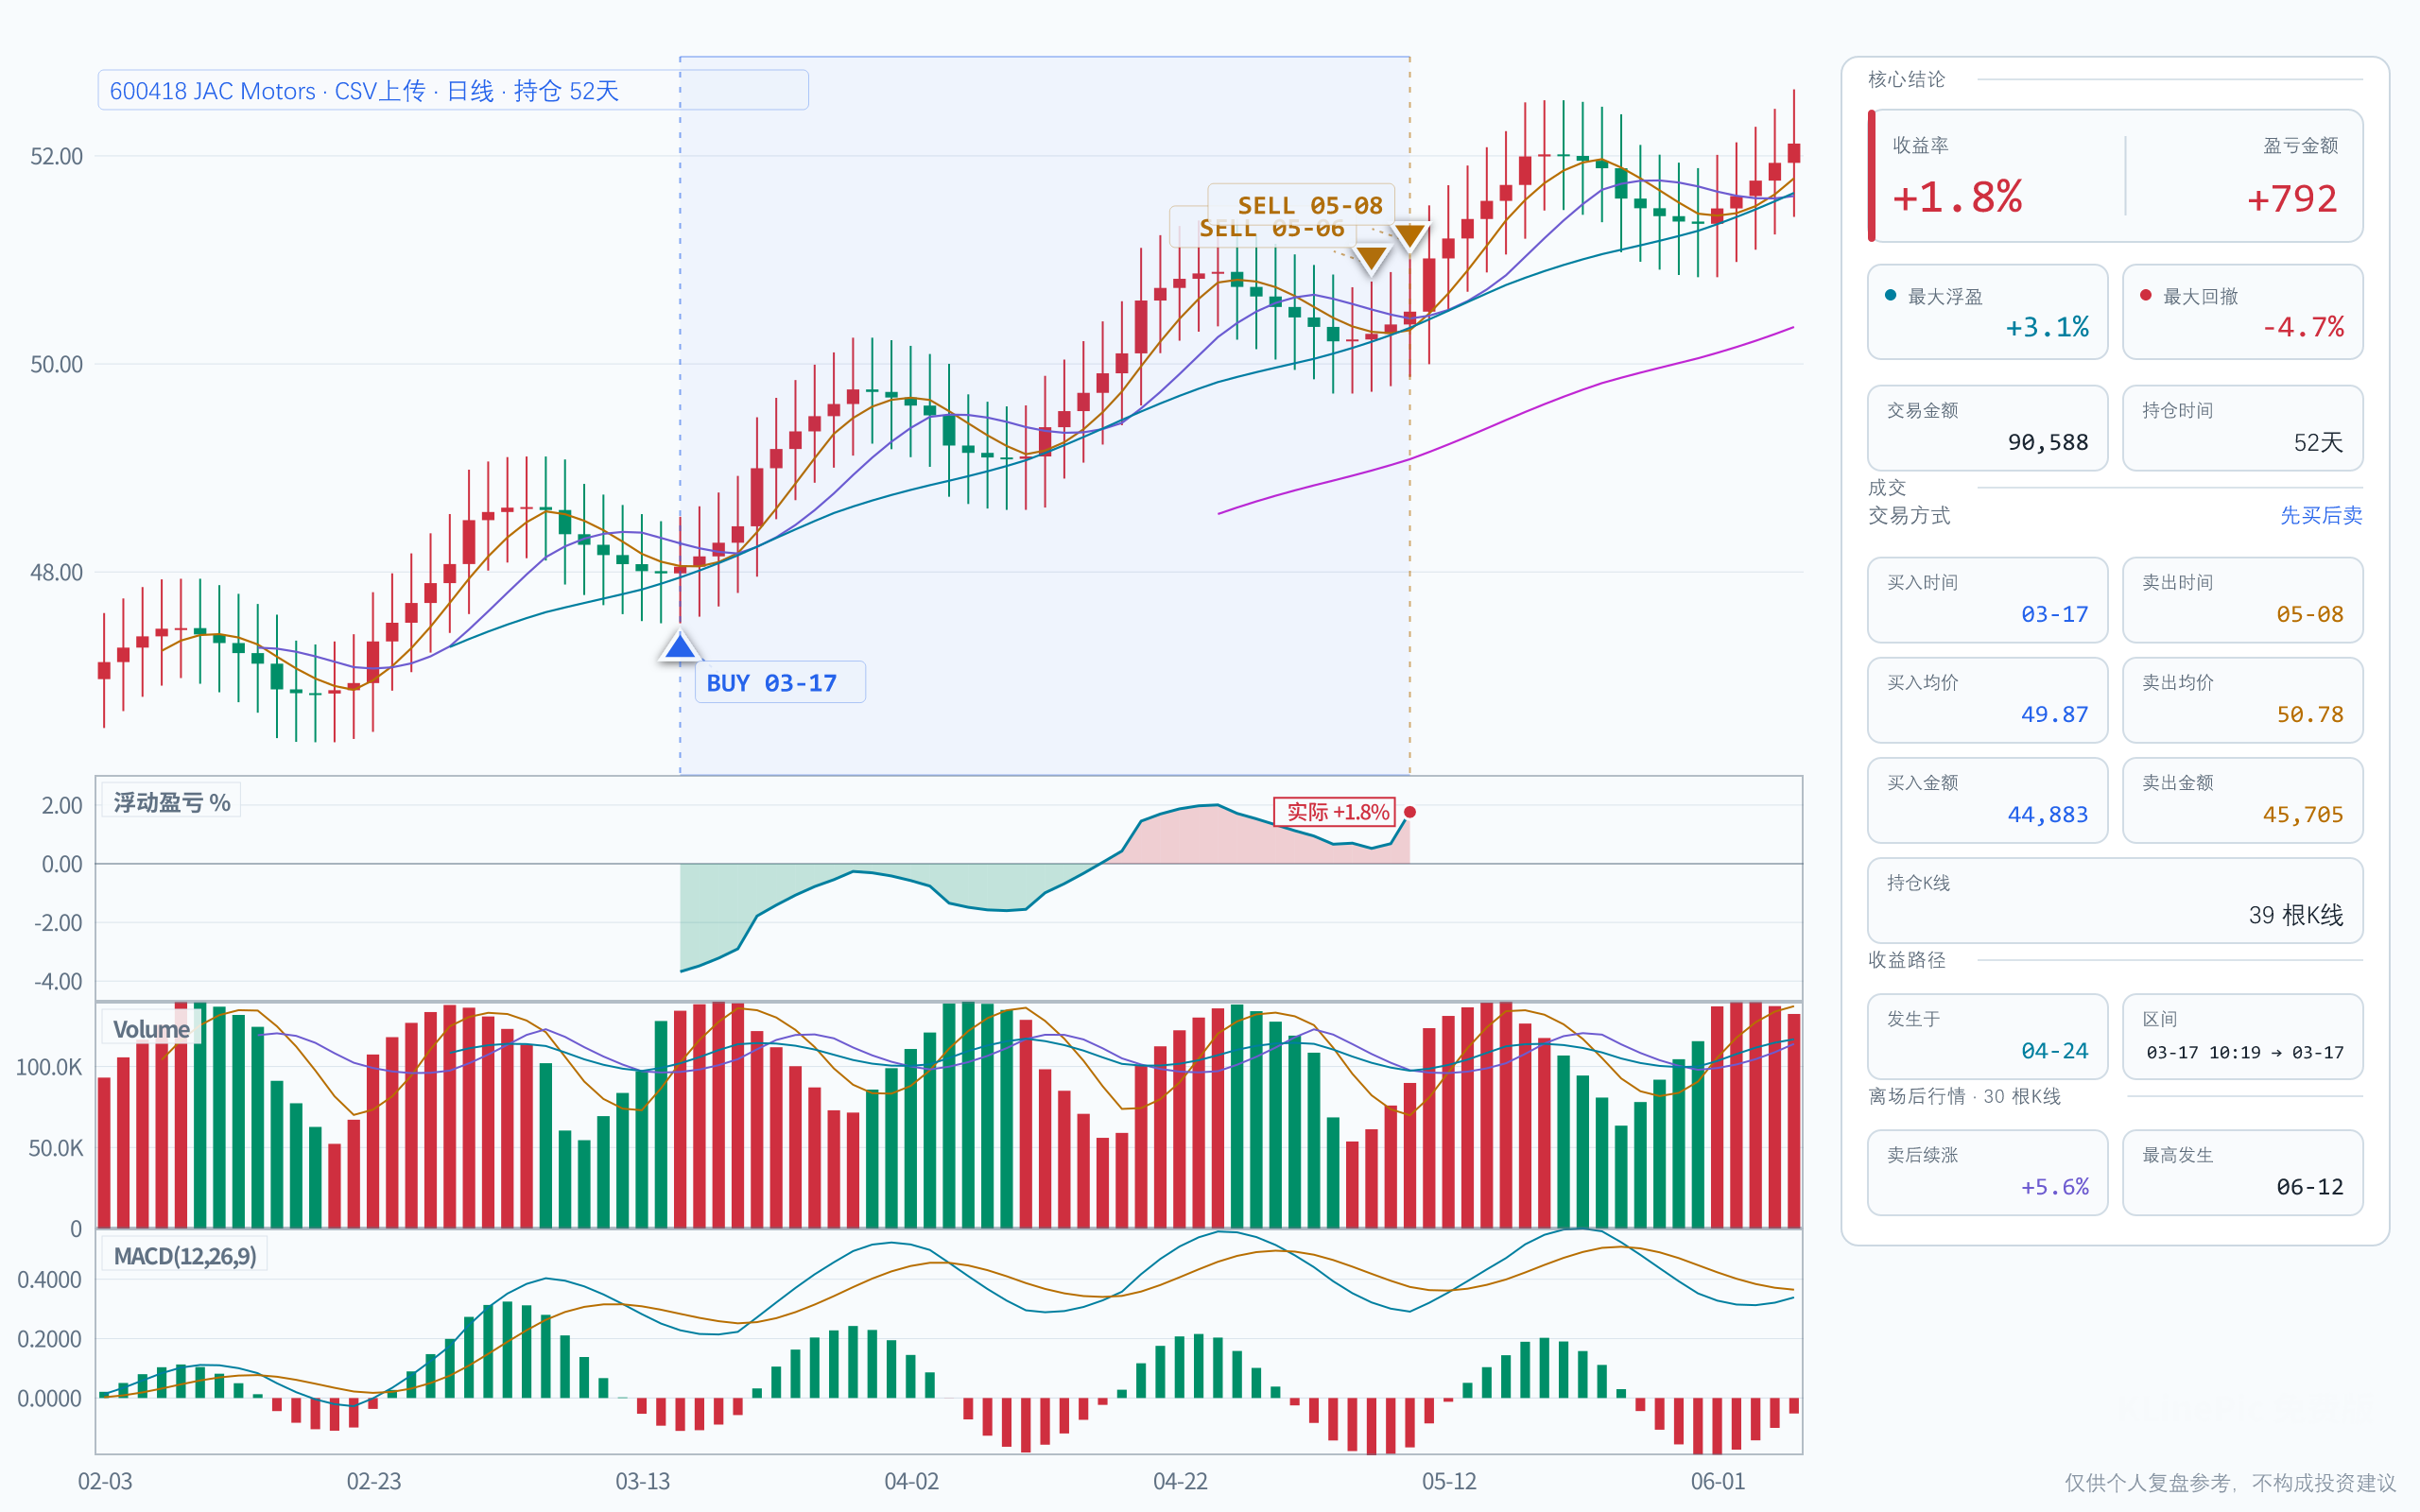
Markets name the document differently — contract note, 交割单, 取引報告書, 체결내역 — but the content barely changes: instrument, side, time, price, quantity, cost. The export pattern is consistent too: find the account area listing executions, set a date range covering both entry and exit, and prefer CSV or Excel over PDF. The notes below are deliberately generic — menus and column labels vary by broker.
For US accounts, the confirmation is a regulated document: the SEC's investor bulletin How to Read Confirmation Statements explains that a broker-dealer is generally required to send a written confirmation identifying the security, the amount bought or sold, and the price — precisely the fields a review chart is built from.
Look for History, Activity, Statements, or Transaction History and export CSV where offered. Monthly PDF statements still work — retype the few trade rows you need.
Mainland broker apps and PC clients typically expose 交割单 or 成交记录 under a query or statements menu. Many cap each query at a fixed date window, so pull several ranges if a position spans months.
Trade-history downloads (取引履歴 / 約定履歴, 거래내역 / 체결내역) usually live in the account-service or trading-report area. Labels differ by broker, so identify columns by content.
Cash equities, margin, futures, and funds often export separately. Export only the product you want to review; times are usually exchange-local, with no timezone printed.
Statements mix executions with cash and administrative rows. Only genuine fills belong on a review chart:
| Row type on the statement | Keep or drop | Why |
|---|---|---|
| Buy and sell executions | Keep | These become the entry and exit markers. |
| Partial fills of one order | Keep — share one trade_id |
Grouped fills render as a single round trip. |
| Deposits, withdrawals, transfers | Drop | Cash movement is not a trade. |
| Dividends, interest, tax, fee-only rows | Drop | They would draw phantom markers; fold per-trade charges into fee if you track them. |
Column headers vary by broker and language, so this table maps by what each column contains rather than by exact label — every contract note carries an instrument identifier, a side, a date or time, a price, and a quantity. The full specification is in the data protocol.
| Typical column in your export | KLinePic field | Notes |
|---|---|---|
| Contract note or order number | trade_id |
One ID per round trip; a hand-made ID such as CN-600519-01 works fine. |
| Security code / ticker / ISIN | symbol |
The exchange code — a plain ticker for US stocks, the six-digit code for A-shares. Drop the security-name column. |
| Side or action indicator | event_type |
Lowercase buy or sell, whatever wording the statement uses. Skip anything that is not an execution. |
| Long/short context | position_side |
Cash-equity purchases are long; use short for short sales or futures shorts. |
| Trade date + execution time | time |
Combine into ISO 8601 with an explicit offset, e.g. 2026-06-10T10:30:00+08:00; date-only still works on daily candles. |
| Executed or average price | price |
The price the fill executed at — not your order's limit price and not the net cash amount. |
| Quantity / shares / units | quantity |
The executed amount as a positive number; the side belongs in event_type, not in a minus sign. |
| Commission and per-trade charges | fee |
Optional — sum the per-fill charges, or use 0 if you do not track fees per fill. |
| Fee currency | note |
There is no fee-currency field. Extra columns are ignored on import and listed back to you; keep the currency as note text such as fee_asset=CNY only when you want it preserved. |
One row per fill, one shared trade_id per round trip. A complete A-share swing trade cleaned out of a 交割单 is two rows:
trade_id,symbol,event_type,position_side,time,price,quantity,fee,note
CN-600519-01,600519,buy,long,2026-06-10T10:30:00+08:00,1568.20,100,5.00,fee_asset=CNY
CN-600519-01,600519,sell,long,2026-06-18T13:45:00+08:00,1632.40,100,5.00,fee_asset=CNY
The same shape covers US tickers, Japanese and Korean securities codes, futures, and forex — the chart only needs stable trade meaning. From these two rows KLinePic draws entry and exit markers on real candles, shades the holding window, and computes return, max run-up, and max drawdown. For input/output proof, open the broker statement example, or start from the trade template.
How the common options compare for getting statement fills onto a real candlestick chart:
| KLinePic | Manual screenshot + spreadsheet | Typical trading-journal SaaS | |
|---|---|---|---|
| Setup time | Minutes — upload or paste fills in the browser | Slow — recreate chart and annotations by hand per trade | Moderate — sign up, then import or sync broker data |
| Account required | No — render without an account | No | Usually yes |
| Output | Annotated K-line review chart with trade stats | Static screenshot plus separate spreadsheet rows | Dashboards and statistics; chart output varies |
| Buy/sell markers on real K-line | Yes — plotted from your actual fills | Only if you draw them yourself | Varies by product |
| Shareable image | Yes — the chart image is the primary output | Manual cropping and annotation each time | Usually screenshots of dashboards |
| Cost to start | Free to start; watermark-free hi-res export is paid | Free, but costs time on every single trade | Often subscription-based |
If the chart shows an entry you never made, a transfer, dividend, or tax-only row slipped through — keep only actual buy and sell executions.
Contract notes often print both. Use the trade date for time — settlement happens days later and shifts markers onto the wrong candles.
Statement times are usually exchange-local with no timezone printed. Write timestamps as ISO 8601 with an explicit offset (e.g. +08:00 for A-shares).
An order filled in three chunks is three statement rows. Give all three the same trade_id so they render as one trade, not three fragments.
Use the bare exchange code: 600519 for an A-share, AMZN for a US stock. Security names and ISIN-plus-name strings will not match K-line data.
Statements show an executed price and a net cash amount baking in fees and taxes. Map the executed price into price; put charges in fee.
Yes. Keep the rows that represent actual trades, then map symbol, side, time, price, quantity, and fee into the KLinePic trade schema. Two mapped rows — one buy, one sell — are enough to render a full review chart.
No. Map by meaning, not by label: find the columns carrying symbol, side, time, price, and quantity in whatever language. The KLinePic interface is bilingual, in English and Chinese.
Yes. A review chart needs only a handful of fields per fill, so a round trip retyped from a PDF is two short CSV rows: symbol, side, time, price, and quantity for the entry and for the exit.
Give every fill of the same round trip the same trade_id. Rows sharing a trade_id are grouped into one trade, so a scaled entry or staged exit renders as a single chart.
No. You upload or paste trade rows yourself — there is no broker login or account sync. KLinePic is free to start with no account required to render; watermark-free high-resolution export is a paid option.
Yes. Batch rendering is supported, and a documented Agent API covers automated generation — see the guide at klinepic.com/guides/trade-review-chart-api/ and the data protocol at klinepic.com/docs.