US and international brokers
Log in and look for History, Activity, or Statements. Prefer a CSV export over the PDF, and filter to a date range covering both entry and exit.
Broker statement trade review
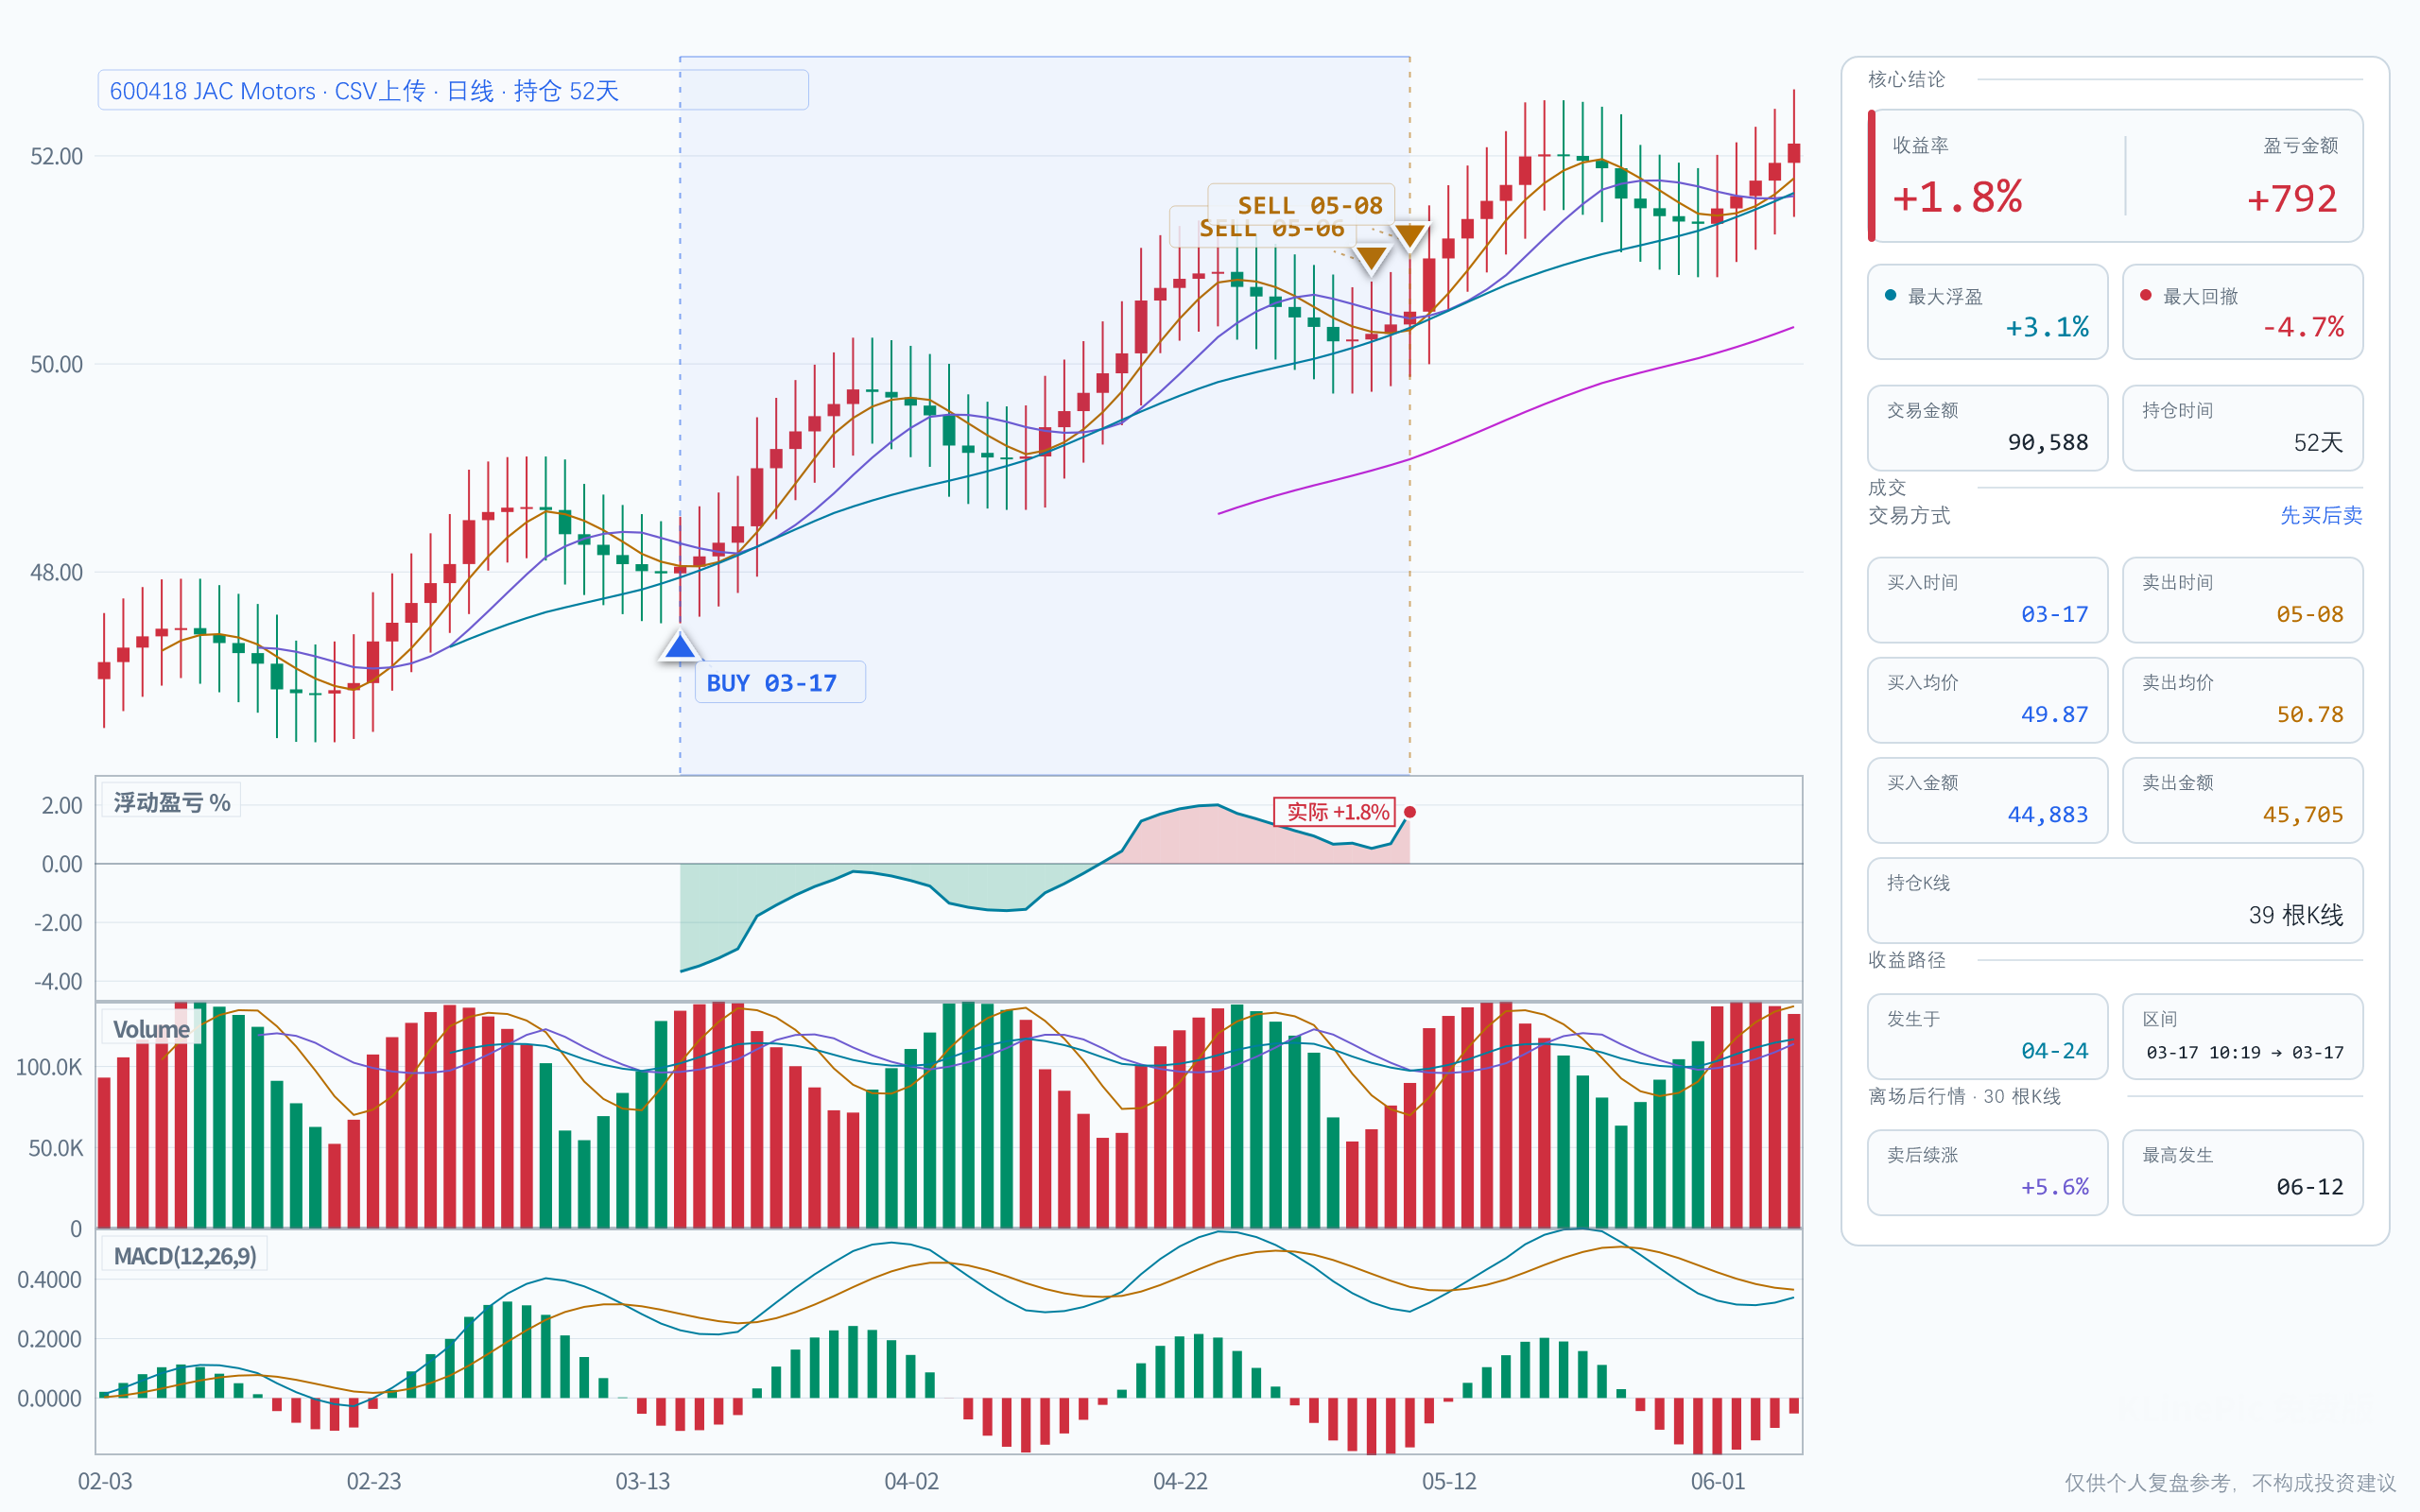
This guide is for traders whose fills live in a broker document — a monthly statement, trade confirmation, contract note, or A-share 交割单 — rather than a clean spreadsheet. Pull out the executed trades, map them to a small CSV, and KLinePic renders each round trip on real candles with buy/sell markers, holding window, return, max run-up, and max drawdown — free to start, no account required.
Whatever your market calls the document, regulators make brokers hand you a record of every execution. The SEC's investor bulletin on how to read confirmation statements says a US confirmation identifies the security, the amount bought or sold, and the price — and prescribes no particular layout, which is why no two exports share the same headers. FINRA's investor guidance likewise lists transaction date, price, and quantity as core details. A review chart needs exactly those fields, so this guide maps columns by content, not by name.
Log in and look for History, Activity, or Statements. Prefer a CSV export over the PDF, and filter to a date range covering both entry and exit.
Mainland brokers export the record as a 交割单 or 成交记录 from the app or trading terminal. Layouts vary by broker, so map by content — the A-share guide covers this market in depth.
Japanese brokerages call it 取引履歴 or 約定履歴; Korean brokerages 거래내역 or 체결내역. Export the execution rows and keep the original statement as audit evidence.
Remove account numbers and personal identifiers before uploading. A review chart only needs symbol, side, time, price, and quantity.
Statement layouts are not standardized, so the table below maps a statement's typical columns — whatever your broker labels them — onto the nine KLinePic CSV fields. The full specification lives in the data protocol.
| Typical column on your statement | KLinePic field | Notes |
|---|---|---|
| Order, contract, or confirmation number | trade_id |
Reuse one ID for every fill of the same round trip — a hand-made ID like BROKER-600519-01 works. |
| Security code / ticker | symbol |
The tradable code — a 6-digit A-share code like 600519 or a ticker like AMZN. Drop the security-name column. |
| Side / action (Buy, Sell, 买入, 卖出) | event_type |
Normalize to lowercase buy or sell; skip dividends, transfers, and other non-trade actions. |
| Direction context | position_side |
Plain stock purchases are long; use short for short sales or short futures legs. |
| Trade date + trade time | time |
Statements often split date and time — combine them into ISO 8601 with the exchange's offset, e.g. 2026-06-10T10:30:00+08:00. |
| Execution / average fill price | price |
The actual execution price — not the order's limit price, and not the total amount. |
| Quantity / shares / volume | quantity |
Units executed, as a positive number — the side lives in event_type, not a minus sign. |
| Commission, stamp duty, levies | fee |
Optional — sum per-fill charges, or use 0 if you do not track fees. |
| Settlement currency | note |
Optional free text — there is no currency column, so keep it inside note as text like fee_asset=CNY, or drop it. Any header outside these nine fields is rejected. |
One row per fill, one shared trade_id per round trip. A complete A-share swing trade from a 交割单 is two rows:
trade_id,symbol,event_type,position_side,time,price,quantity,fee,note
BROKER-600519-01,600519,buy,long,2026-06-10T10:30:00+08:00,1568.20,100,5.00,fee_asset=CNY
BROKER-600519-01,600519,sell,long,2026-06-18T13:45:00+08:00,1632.40,100,5.00,fee_asset=CNY
From these two rows KLinePic draws entry and exit markers on real candles, shades the holding window, and computes return, max run-up, and max drawdown. The broker CSV template is ready to edit, and the broker statement example pairs a real input CSV with its output PNG.
| KLinePic | Manual screenshot + spreadsheet | Typical trading-journal SaaS | |
|---|---|---|---|
| Setup time | Minutes — upload or paste fills | Slow — recreate annotations by hand per trade | Moderate — sign up, then import broker data |
| Account required | No — render without an account | No | Usually yes |
| Output | Annotated K-line review chart with trade stats | Static screenshot plus separate spreadsheet rows | Dashboards and statistics; chart output varies |
| Buy/sell markers on real K-line | Yes — plotted from your actual fills | Only if you draw them yourself | Varies by product |
| Shareable image | Yes — the chart image is the primary output | Manual cropping and annotation each time | Usually screenshots of dashboards |
| Cost to start | Free to start; watermark-free hi-res export is paid | Free, but costs time per trade | Often subscription-based |
If a chart shows an entry you never made, a dividend, interest, tax, transfer, or fee-only line slipped through — keep only actual buy and sell executions.
A timestamp without an offset can land a marker on the wrong candle. Write times as ISO 8601 with the exchange's offset; date-only rows are fine on daily candles.
An order filled in three chunks appears as three statement rows. Give all three the same trade_id so they render as one trade instead of three fragments.
Use the tradable code — 600519 for an A-share, AMZN for a US stock. Security names or long descriptions will not match K-line data.
Statements often carry both a quantity column and a total-amount column. Map the unit count to quantity and the per-unit fill price to price — never the total.
Exports may mark sells with negative quantities or local words such as 买入/卖出. Normalize the side into event_type as buy or sell and keep quantity positive.
Yes. Keep trade date and time, symbol, buy/sell side, price, and quantity from the executed rows, and map them onto the KLinePic CSV fields. Non-trade rows — cash transfers, interest, dividends, taxes, fee-only lines — should not become buy or sell markers.
English-speaking brokers say broker statement, trade confirmation, contract note, or execution report; mainland China uses 交割单 or 成交记录, Japan 取引履歴 or 約定履歴, Korea 거래내역 or 체결내역. Whatever the label, the trade rows carry the same core fields.
Give every fill of the same round trip the same trade_id — rows that share a trade_id are grouped into one trade, so a scaled entry or a staged exit still renders as a single review chart.
Use ISO 8601 with the exchange's own UTC offset, such as 2026-06-10T10:30:00+08:00 for A-shares. If the statement only carries a trade date, keep it — daily candles still place the marker correctly.
No. KLinePic is free to start and does not require an account to render a trade review chart. Watermark-free high-resolution export is available as a paid option.
Yes. Batch rendering is supported, and a documented Agent API covers automated generation — see the guide at klinepic.com/guides/trade-review-chart-api/ and the CSV/JSON data protocol at klinepic.com/docs.