Real market candles, fetched for you
Generic candlestick chart makers ask you to type OHLC values. KLinePic loads real K-line data around each trade automatically — crypto, US stocks, China A-shares, futures, forex, and MetaTrader.
Candlestick chart generator
KLinePic is a free online candlestick chart generator for traders who want a chart of their own trades — not a blank OHLC canvas. Upload or paste real fills to get a TradingView-style K-line image with entry/exit (B/S) markers, holding window, return, max run-up, and max drawdown on real market candles. No manual OHLC input, no account required.
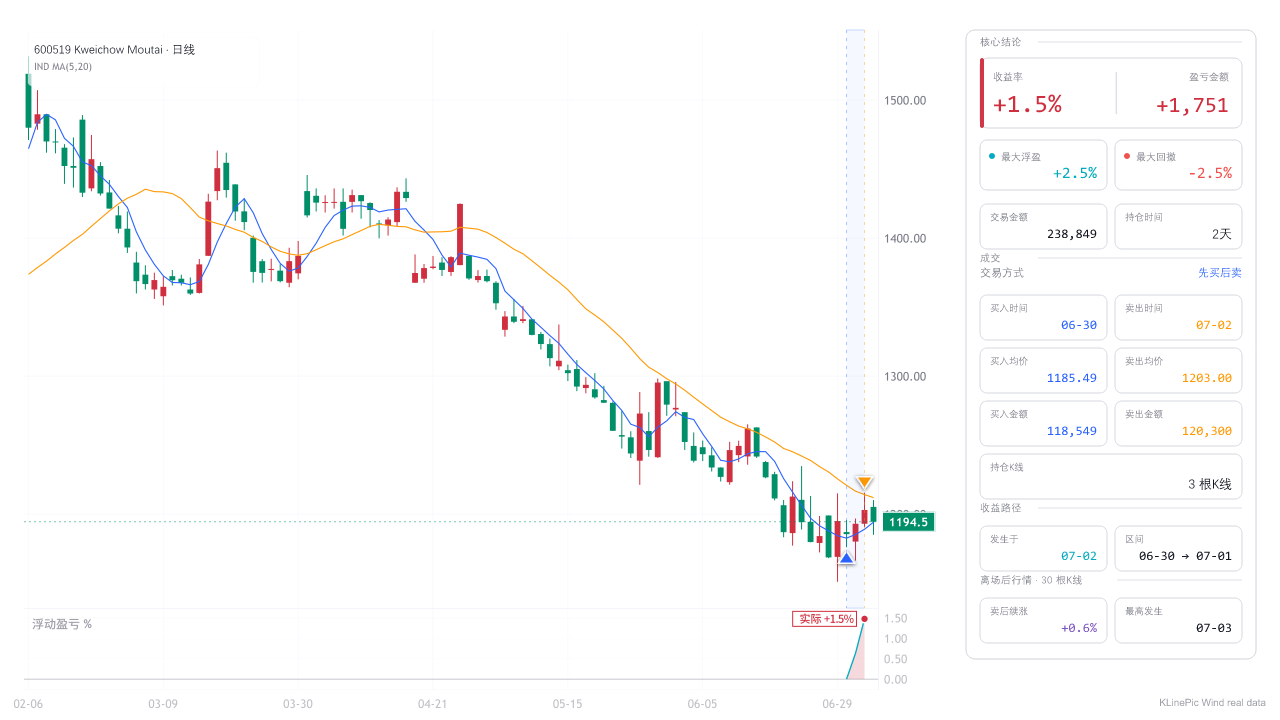
Generic candlestick chart makers ask you to type OHLC values. KLinePic loads real K-line data around each trade automatically — crypto, US stocks, China A-shares, futures, forex, and MetaTrader.
Each chart annotates entries, exits, holding window, return, max run-up, and max drawdown, with optional indicator panels such as MACD. It is a trade review chart, not just a picture of candles.
Render one annotated chart per trade for a whole journal in one batch, or automate it through the documented Agent API and CSV/JSON data protocol.
The export path is platform-specific, but the pattern is similar: crypto exchanges keep executed fills under an Orders or Trade History area with an export button; stock brokers put them under Account Statements or Activity. Pick a date range covering your trades and download a CSV.
Expect three quirks: date-range limits per download, separate exports for spot and derivatives, and timestamps printed in local time without an offset. For venue-specific menu paths, see the guides for crypto exchange exports and broker CSV exports — column names differ by platform, so the mapping below stays generic.
Whatever your platform calls its columns, they map onto the same nine KLinePic fields:
| Typical export column | KLinePic field | Notes |
|---|---|---|
| Order ID / Trade ID | trade_id | Reuse one ID for the buy and sell legs of a round trip so they render as one chart. |
| Symbol / Pair / Ticker / Instrument | symbol | Keep the venue's plain trading format, e.g. BTCUSDT or AAPL. |
| Side / Direction | event_type | Normalize to buy or sell. |
| Position side (long/short) | position_side | Only needed for derivatives (hedged futures); omit for spot and stocks. |
| Time / Date / Filled at | time | ISO 8601 with an explicit UTC offset is safest, e.g. 2026-02-28T01:15:00+08:00. |
| Price / Fill price / Avg price | price | The executed fill price, not the order's limit price. |
| Quantity / Amount / Filled / Size | quantity | Base-asset or share quantity, not quote-currency notional. |
| Fee / Commission | fee | Optional; improves net-return accuracy. |
| Fee currency | note | There is no fee_asset column — keep the fee currency as free text in note, e.g. fee_asset=USDT, or drop it. Any unrecognized column makes the row fail validation. |
trade_id,symbol,event_type,position_side,time,price,quantity,fee,note
T-001,BTCUSDT,buy,long,2026-02-28T01:15:00+08:00,65205.21,0.22,0.92,fee_asset=USDT
T-001,BTCUSDT,sell,long,2026-02-28T08:00:00+08:00,65998.04,0.22,0.93,fee_asset=USDT
| KLinePic | Manual screenshot + spreadsheet | Typical trading-journal SaaS | |
|---|---|---|---|
| Setup time | Minutes — upload a CSV and render | Slow — screenshot, annotate, and log stats by hand | Moderate — sign up, then import or sync history |
| Account required | No account needed to render | No | Usually yes |
| Output | Annotated K-line chart image | Static screenshot plus a separate spreadsheet | In-app dashboards and statistics |
| Buy/sell markers on real K-line | Yes — drawn automatically from your fills | Only if you draw them by hand | Varies by product |
| Shareable image | Yes — built for sharing | Yes, but quality and consistency vary | Often locked inside the app |
| Cost to start | Free to start; watermark-free high-res export is paid | Free, but costs time per trade | Commonly freemium with paid tiers |
time field, e.g. +08:00 or Z.quantity field wants the base-asset or share count, not the cash value.position_side so the legs are not merged into one trade.note as free text, e.g. fee_asset=USDT or exchange=OKX.Yes. KLinePic is free to start and no account is required to render a trade review chart. Watermark-free high-resolution export is a paid option.
No. KLinePic fetches real market candles automatically — you only upload your trades.
A CSV with trade_id, symbol, event_type, time, price, and quantity is enough; position_side, fee, and note are optional, and extra details such as the fee currency go inside note as free text. Fills from Binance, OKX, Bybit, Bitget, Gate, MEXC, KuCoin, HTX, US stock brokers, China A-share statements, futures, forex, and MetaTrader are covered.
Yes. Batch rendering produces one annotated chart per trade in a single run; a documented Agent API and CSV/JSON data protocol cover automated generation.
Almost always a timezone issue: many exports print local time without an offset. Write times in ISO 8601 with an explicit UTC offset, such as 2026-02-28T01:15:00+08:00.
Yes. The KLinePic interface is bilingual — English and Chinese.