Unsupported symbol
Normalize the symbol first. For example, keep AAPL as AAPL, turn BTC/USDT into BTCUSDT, and keep A-share codes as six digits unless the selected source asks for a suffix.
Market data coverage
This guide is for traders, analysts, and AI agents who want buy and sell markers to sit on the correct candles before trusting a review chart. It explains which markets KLinePic covers automatically, how to sanity-check a symbol, and exactly what to upload when the public data source is not the right proof for your trade.
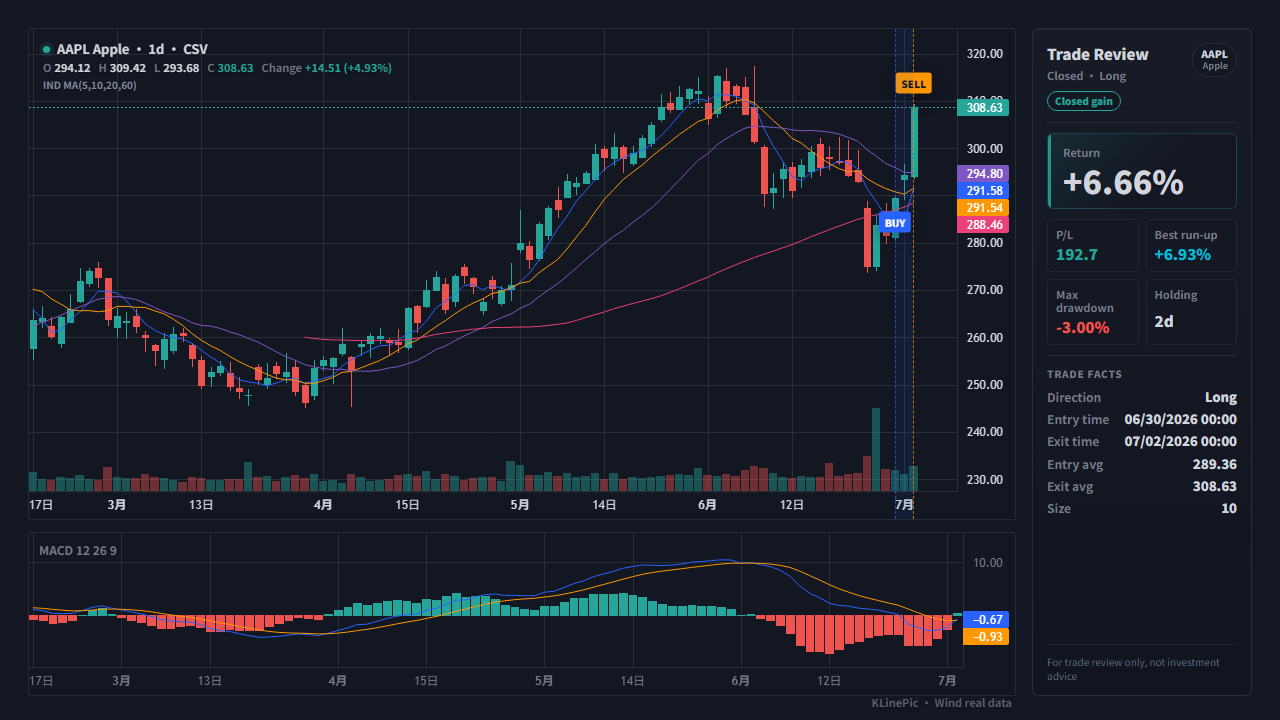
KLinePic renders review charts from crypto exchange fills (Binance, OKX, Bybit, Bitget, Gate, MEXC, KuCoin, HTX), US stock brokers, China A-share statements, futures, forex, and MetaTrader. For each market there is a default path that uses automatic K-line data, and an escape hatch: your own candle CSV.
| Market | Default path | Use custom K-line CSV when |
|---|---|---|
| Crypto | Use exchange-style symbols such as BTCUSDT, ETHUSDT, or SOLUSDT. Public exchange candles are usually the first choice for common pairs. | The pair is delisted, synthetic, private, or comes from a backtest or non-standard exchange export. |
| A-shares | Use six-digit stock codes such as 600519 or 000001 and keep China market time in mind. | You need exact broker-adjusted candles, non-standard adjustments, intraday research data, or a licensed internal data feed. |
| US stocks | Use tickers such as AAPL, TSLA, NVDA, or MSFT and include New York time offsets in fills. | The symbol is unsupported, the broker export uses a special instrument, or you need proprietary minute bars. |
| Futures | Use the supported contract symbol format for the selected source. | The contract has a custom session, rollover logic, local exchange calendar, or research-only candle set. |
| Backtest and private data | Map fills to KLinePic trade rows first. | Always provide K-line CSV if the backtest used synthetic, adjusted, or private candles. |
KLinePic starts from your fills, so the first step is always the same: get a trade or order history export out of your platform. Menu names and file layouts differ by exchange and broker, so this page keeps the guidance general; the per-platform guides linked at the bottom of this page cover individual exchanges and brokers in more detail.
As a rule of thumb, crypto exchanges expose trade or order history export under their orders or transaction history area, stock brokers publish activity or statement downloads in account documents, and MetaTrader can save an account history report from the terminal. Whatever the source, aim for an export at fill level (one row per execution) rather than a summary, and note two common quirks: many platforms limit each export to a date range, so long histories may need several files, and exported timestamps may be in exchange time, UTC, or your local time — check which one before you map anything.
Also watch for products split across exports: spot and futures history usually live in separate reports, so download both if you traded both. If your platform has no CSV export at all, you can paste fills manually — a review chart only needs a handful of columns per row.
Column names vary widely between platforms, so map by meaning, not by name. The table below maps the typical columns found in exchange and broker exports to the KLinePic CSV fields defined in the data protocol. Never guess: open your export and confirm what each column actually contains before mapping it.
| Your export's typical column | KLinePic field | Notes |
|---|---|---|
| Order ID, trade ID, or reference number | trade_id | Groups fills into one reviewable trade. Keep partial fills of the same position under one trade_id. |
| Pair, symbol, ticker, or stock code | symbol | Normalize to the coverage table format above, e.g. BTCUSDT, AAPL, 600519. |
| Side or action (buy/sell) | event_type | Map to buy or sell. Watch exports that encode side inside a signed quantity instead. |
| Direction or position (long/short) | position_side | Needed for futures, especially hedged accounts where long and short coexist on one symbol. |
| Filled time, executed time, or trade date | time | Prefer ISO 8601 with an explicit offset, e.g. 2026-06-10T14:30:00-04:00. |
| Fill price or average price | price | Use the execution price per unit, not the total order value. |
| Executed amount or filled quantity | quantity | Base units (coins, shares, contracts) — not the quote-currency value of the fill. |
| Fee or commission | fee | Optional but recommended; keeps the computed return honest. |
| Instrument or stock name | name | Optional display name, e.g. Apple Inc. Leave it blank if your export has none. |
| Fee currency or fee coin | note | There is no dedicated fee-currency field; if you want to keep it, record it inside note, e.g. fee_asset=USDT. |
KLinePic accepts custom candles when you provide the standard columns below. The trade symbol and K-line symbol should match after normalization, and the candle rows should cover the full window you want to see: the run-up before entry, the holding period, and enough bars after exit to show how the move resolved.
symbol,time,open,high,low,close,volume
AAPL,2026-06-10T14:30:00-04:00,198.00,199.20,197.80,198.40,1200000
AAPL,2026-06-10T14:45:00-04:00,198.40,200.10,198.20,199.85,980000
Keep one consistent bar period per file, keep timestamps in ascending order, and use the same timezone convention as your trade rows. If your source data is adjusted for splits or dividends, use the same adjustment for both candles and fills — mixing adjusted candles with raw fill prices puts markers visibly off the candle they belong to.
| KLinePic | Manual screenshot + spreadsheet | Typical trading-journal SaaS | |
|---|---|---|---|
| Setup time | Minutes: paste or upload fills and render. | Slow: capture, crop, and annotate every trade by hand. | Moderate: create an account, then import or connect data. |
| Account required | No account needed to render a review chart. | None. | Usually yes. |
| Output | Annotated K-line chart with markers, return, run-up, and drawdown. | A static screenshot plus a separate spreadsheet of numbers. | Dashboards and statistics inside the app. |
| Buy/sell markers on real K-line | Yes, placed from your actual fills. | Only if you draw them yourself. | Varies by product. |
| Shareable image | Yes; watermark-free high-resolution export is a paid option. | Yes, but rebuilt manually each time. | Sometimes; often a screenshot of a dashboard. |
| Cost to start | Free to start. | Free, but pays with your time. | Commonly subscription-based. |
Normalize the symbol first. For example, keep AAPL as AAPL, turn BTC/USDT into BTCUSDT, and keep A-share codes as six digits unless the selected source asks for a suffix.
Increase the requested K-line window or upload candles that cover the full pre-trade, holding, and post-trade period. Gaps around the entry or exit are what most often push markers onto the wrong bar.
Use ISO timestamps with offsets, such as 2026-06-10T14:30:00-04:00 or 2026-06-10T09:35:00+08:00. Exports without an offset are the single most common cause of markers landing hours away from the real fill.
Some exports report the quote-currency value of a fill (for example, the USDT amount) next to the base amount. Map the base quantity — coins, shares, or contracts — into the quantity field, never the notional value.
One order can execute as several fills. Keep all fills of the same position under one trade_id so the chart shows a single trade with averaged entries, instead of a scatter of tiny disconnected trades.
If the strategy used adjusted, synthetic, or internally cleaned candles, upload those exact candles instead of relying on a public source. A review chart should prove the trade against the data it was actually made on.
Upload your own K-line CSV when the automatic data source does not cover the symbol, the trade uses a private or backtest dataset, the timezone must match a broker export exactly, or the public source has missing candles.
Timezone controls how timestamps are displayed and matched to candle windows. For best marker alignment, include explicit offsets in trade rows and make sure custom K-line rows use the same timeline.
No. It is convenient for common symbols, but custom K-line CSV is the better proof path when the source data must match a broker, exchange export, or backtest exactly.
Use exchange-style pairs such as BTCUSDT for crypto, plain tickers such as AAPL for US stocks, and six-digit codes such as 600519 for A-shares. The trade symbol and the K-line symbol must match after normalization, otherwise the markers cannot be placed.
No. KLinePic is free to start and does not require an account to render a trade review chart, so the fastest coverage test is to paste one or two fills and generate a preview. Watermark-free high-resolution export is a paid option.
Yes. Batch rendering is supported for multiple trade groups, and the documented Agent API can automate chart generation. See the Agent API guide and the data protocol for the exact CSV and JSON contracts.
Use this page together with the public data protocol at /docs, the example pack at /examples/, and the OpenAPI contract at /api/agents/openapi.json.