Binance
Spot trade-history exports — see the Binance guide.
Crypto exchange trade history chart
For traders who fill orders across crypto exchanges and want every entry and exit on the real candlestick chart — no screenshots, no hand-drawn arrows. Export your trade history, map it once to a standard trade file, and KLinePic renders a shareable review image with buy/sell (B/S) markers, holding window, return, max run-up, max drawdown, and optional indicator panels such as MACD. Free to start; no account needed to render.
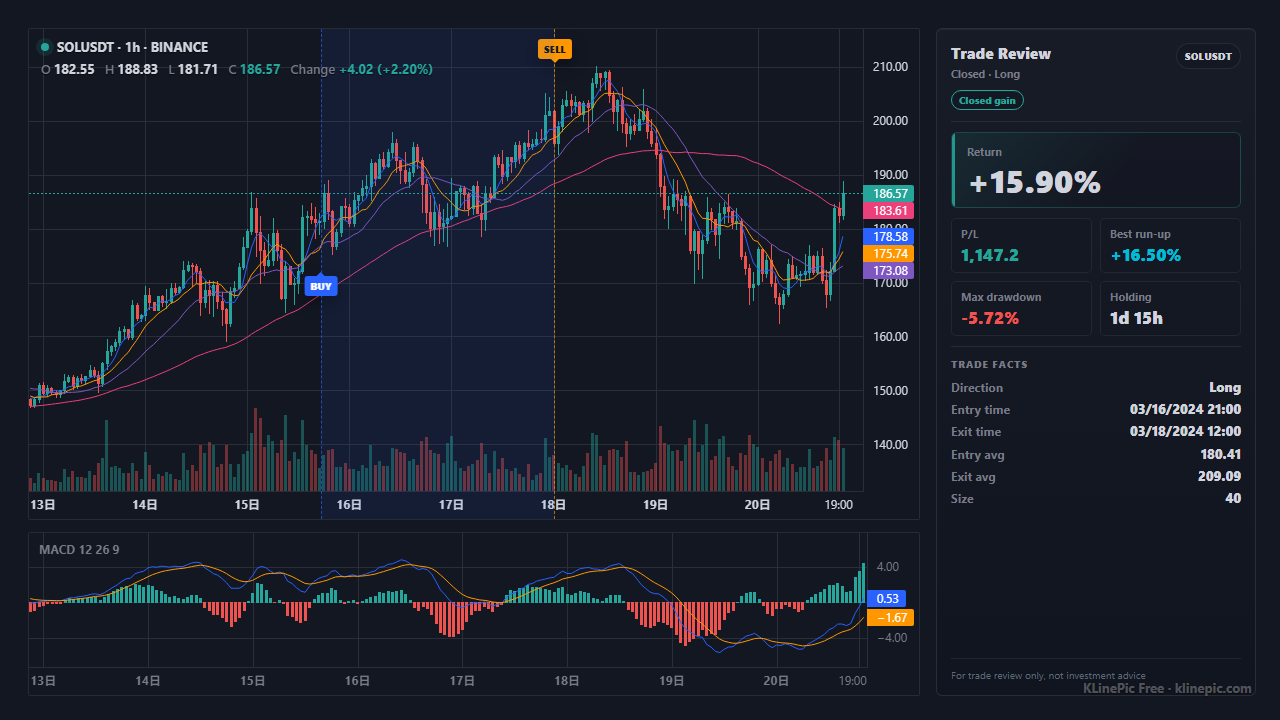
KLinePic reads a standard CSV, so the source exchange does not matter — map the columns once and one workflow covers spot, margin, and futures history:
Spot trade-history exports — see the Binance guide.
Order Center trading-history downloads — see the OKX guide.
Order and trade-history export files — see the Bybit guide.
Spot and futures transaction history — see the Bitget guide.
Spot and perpetual trade history — see the Gate.io guide.
Spot and futures history — see the MEXC guide.
Trade-history exports — see the KuCoin guide.
HTX and legacy Huobi order history — see the HTX/Huobi guide.
Almost every major exchange offers a self-service export under a menu named Orders, Order Center, or Data Export. Everywhere, pick fill-level trade history over order history when both exist — fills carry the exact executed price and quantity — and check date-range caps first, since most venues limit each export and expire the download link. Documented examples from official help centers:
If your venue is not listed, find the Export control on its trade-history page and confirm the menu path in its help center — these flows change often.
Exchanges do not share a column vocabulary — the same concept ships as Pair, Market, Instrument, or Symbol depending on the venue. KLinePic keeps the meaning stable with nine standard fields; translate whatever your export calls each concept.
| Typical export column | KLinePic field | Notes |
|---|---|---|
| Trade ID / Order No. / Transaction ID | trade_id | Reuse one trade_id across the entry and exit rows of a round trip. |
| Pair / Market / Symbol / Instrument | symbol | Flatten BTC/USDT or BTC-USDT-SWAP to one convention such as BTCUSDT. |
| Side / Direction (buy or sell) | event_type | Use buy or sell per fill; ignore order-type values such as limit or market. |
| Position side / Hold side (futures) | position_side | long or short; required to disambiguate hedge-mode futures fills. |
| Time / Date / Filled time | time | ISO 8601 with an explicit offset; check whether the export uses UTC or local time. |
| Price / Filled price / Avg. price | price | Prefer the per-fill price over the order average when both exist. |
| Amount / Filled quantity / Executed | quantity | Base-asset amount, not the quote-currency total (often labeled cost or total). |
| Fee / Commission | fee | Numeric portion only. |
| Fee asset / Fee currency | note | Not a KLinePic column — keep it as note text like fee_asset=USDT. If the export embeds the asset in the fee cell ("0.0012 ETH"), map the number to fee and the asset into note. |
A few venues document their export schema officially: Kraken describes each field of its trades export — txid, ordertxid, pair, time (in UTC), type, price, cost, fee, vol — in its Trades History FAQ. Most do not, so generate a small test export and confirm each column before mapping a full year.
Whatever the source, every normalized row carries the nine core fields — trade_id, symbol, event_type, position_side, time, price, quantity, fee, note. Extra source columns such as exchange or fee_asset are ignored on import and listed back to you; put audit details like venue or fee currency inside note as free text only when you want them preserved:
trade_id,symbol,event_type,position_side,time,price,quantity,fee,note
OKX-BTC-001,BTCUSDT,buy,long,2026-06-03T09:15:00+00:00,67850.5,0.03,0.00002,exchange=OKX fee_asset=BTC
OKX-BTC-001,BTCUSDT,sell,long,2026-06-03T15:45:00+00:00,69120.2,0.03,2.07,exchange=OKX fee_asset=USDT
Download the exchange fill template, see the full specification in the data protocol, and open the crypto exchange fills example for input and output proof.
Step 5 is where the review actually happens: the Gate.io kline pattern chart guide has a worked section on reading the candles around your fills — entry clusters at support, wick rejections at exits.
| KLinePic | Manual screenshot + spreadsheet | Typical trading-journal SaaS | |
|---|---|---|---|
| Setup time | Minutes: upload or paste fills, render | Hours per batch of trades | Account setup, often with API keys |
| Account required | No account needed to render a chart | None | Usually required |
| Output | Annotated K-line image: entry/exit markers, holding window, return, run-up, drawdown | Static screenshots plus spreadsheet stats | Web dashboards and statistics |
| Buy/sell markers on a real K-line | Yes, plotted from your actual fills | Only if you draw them yourself | Varies by product |
| Shareable image | Yes; watermark-free high-resolution export is a paid option | Yes, assembled by hand | Often a dashboard screenshot |
| Cost to start | Free to start | Free, but slow | Typically subscription-based |
Yes. Any export works once it is mapped to the stable fields — trade_id, symbol, event_type, position_side, time, price, quantity, fee, note. The original column names do not matter.
No. KLinePic renders from a CSV you upload or paste, so you never connect exchange API keys, and no account is required to render a trade review chart.
Yes. The workflow is format-based: reshape any export into the standard fields and the chart renders the same way as for any listed venue.
Export each product line separately and map both to the standard fields, setting position_side (long or short) on futures rows. They can then share one CSV.
Any timezone works if each timestamp carries an explicit offset, such as 2026-06-03T09:15:00+00:00. Exports that use local exchange time without saying so cause misplaced markers — normalize to UTC if unsure.
Yes. Batch rendering is supported, and automated pipelines can use the documented Agent API guide plus the CSV/JSON data protocol.
Rendering and sharing a trade review chart is free and requires no account. Watermark-free high-resolution export is available as a paid option.