Assuming OHLC column order
Coinbase candles are [ time, low, high, open, close, volume ]. Parse by position into named fields and reorder explicitly — a chart drawn with low/high in the open/close slots looks subtly, maddeningly wrong.
Coinbase historical data download
"Coinbase historical data" means two different things, and mixing them up wastes an afternoon. Market data — the price history of BTC-USD or ETH-USD — comes from a public candles endpoint that needs no API key. Account data — your own trades — comes from CSV reports inside your Coinbase account. This guide covers how to get both, the three traps in the candles response that break naive parsers, and how to combine candles with your fills into an annotated review chart.
Unlike Binance, Coinbase publishes no bulk file archive: long histories are assembled by paging the API, 300 candles at a time. The workflow below deals with that honestly instead of pretending one request is enough.
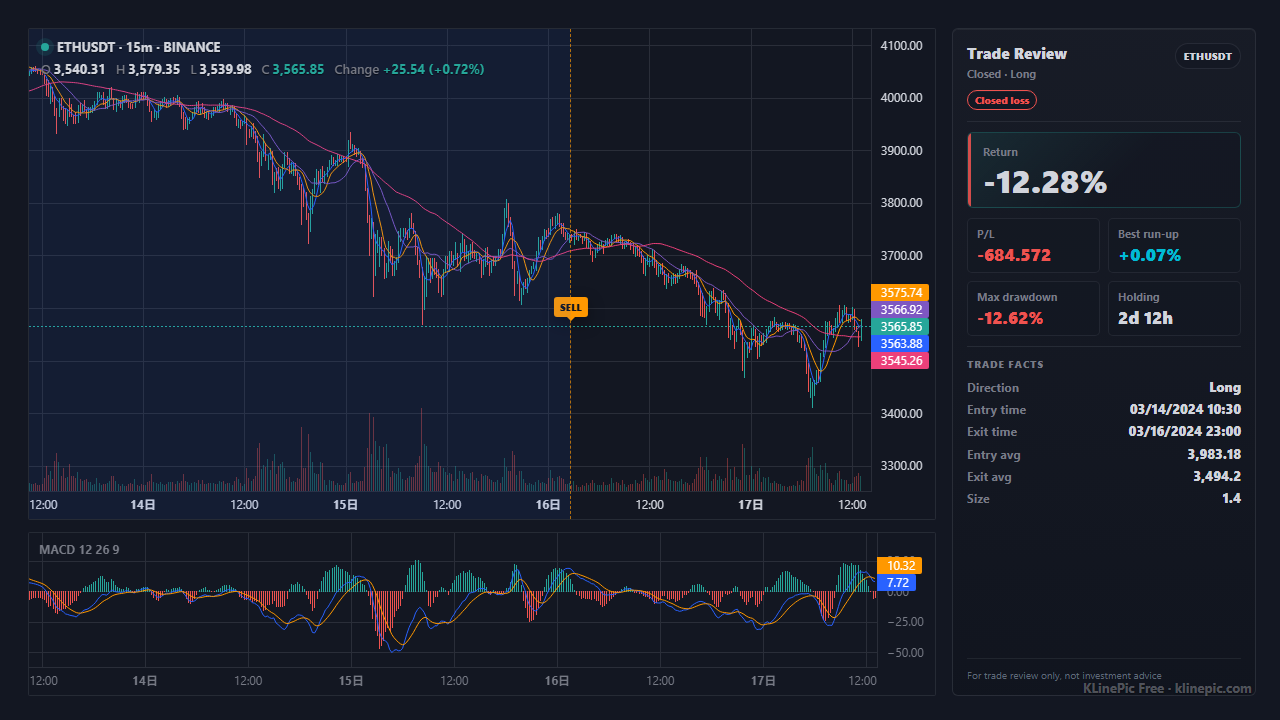
Coinbase Exchange (the order-book venue behind Advanced Trade, formerly Coinbase Pro/GDAX) exposes historical candles as public market data — no authentication required for reads:
GET https://api.exchange.coinbase.com/products/BTC-USD/candles?granularity=3600&start=2024-01-10T00:00:00Z&end=2024-01-22T00:00:00Z
Products are hyphenated pairs (BTC-USD, ETH-USD, SOL-USD); the full list is at GET /products. Three constraints define everything else about working with this endpoint:
60, 300, 900, 3600, 21600, 86400 — that is 1m, 5m, 15m, 1h, 6h, 1d. Anything else is rejected. Need 4h candles? Fetch 1h and aggregate.[ time, low, high, open, close, volume ] — low and high come before open and close. time is the bucket start in Unix epoch seconds (not milliseconds), UTC. Responses can also arrive newest-first, so sort ascending before doing anything.The newer Advanced Trade API surface offers equivalent public candle reads with named granularities (for example ONE_HOUR); if you already integrate with it, use whichever surface you have, and check Coinbase's current API docs for the exact request shape — the constraints above are the ones that trip people either way: fixed granularities, a per-request cap, and epoch-second timestamps.
Binance ships its entire kline history as monthly ZIP files on data.binance.vision (walkthrough in the Binance historical data guide). Coinbase has no public equivalent: the candles API is the archive. That makes the download plan part of the job:
Public market-data endpoints are rate-limited per IP, so put a small delay between requests and back off on HTTP 429 rather than hammering. Keep each window aligned to whole buckets (start and end on the granularity boundary) — misaligned windows are the usual cause of duplicated or missing candles at the seams. If you only need a chart rather than a dataset, skip the whole exercise: a review chart usually doesn't require you to download candles at all, as the last section explains.
To use downloaded Coinbase candles in KLinePic — or any tool that expects OHLC — normalize each [ time, low, high, open, close, volume ] array into the candle CSV from the data protocol, reordering the fields and converting epoch seconds to ISO 8601:
symbol,time,open,high,low,close,volume
BTC-USD,2024-01-10T09:00:00+00:00,46180.00,46340.10,46102.33,46210.50,412.88
BTC-USD,2024-01-10T10:00:00+00:00,46210.50,46333.00,46150.01,46287.20,377.41
Three rules keep the file honest: sort rows ascending by time, keep one granularity per file, and spell symbol identically to the symbol in your trade rows — the two files are joined on it. The market data coverage guide covers the custom-candle path in full.
Candles show the market; your fills show what you did in it. Coinbase provides CSV transaction reports, and Advanced Trade has a separate fills export with per-execution rows — the exact menu paths shift over time, so follow Coinbase's help center for the current wording. The Coinbase trade history chart guide walks through the export and the full column mapping; the short version is that each executed fill becomes one row of KLinePic's trade CSV:
trade_id,symbol,event_type,position_side,time,price,quantity,fee,note
CB-BTC-001,BTC-USD,buy,long,2024-01-10T09:15:00+00:00,46195.20,0.05,2.31,
CB-BTC-001,BTC-USD,sell,long,2024-01-12T15:40:00+00:00,47890.00,0.05,2.39,
Keep executed fills only (drop canceled and unfilled orders), give every fill of one round trip the same trade_id, and write timestamps with an explicit UTC offset. Coinbase's hyphenated BTC-USD form works as a KLinePic symbol directly.
Do you even need to download candles? For a standard review chart: no. Upload the trade CSV at /upload and KLinePic resolves the symbol against public market data automatically. Upload your own candle CSV only when the chart must be built on the exact Coinbase candles — for example when you are reconciling against Coinbase's prices specifically, or the automatic source doesn't carry your pair.
GET https://api.exchange.coinbase.com/products/{product_id}/candles — no API key needed for market data reads.[ time, low, high, open, close, volume ] with time as the bucket start in Unix epoch seconds, UTC — reorder to OHLC and sort ascending before use.symbol,time,open,high,low,close,volume).Coinbase candles are [ time, low, high, open, close, volume ]. Parse by position into named fields and reorder explicitly — a chart drawn with low/high in the open/close slots looks subtly, maddeningly wrong.
Coinbase uses epoch seconds. Feed them to a milliseconds-based date constructor and every candle lands in January 1970. Multiply by 1,000 first — the opposite of the usual crypto-API habit.
A window wider than 300 buckets doesn't fail loudly — you just don't get the whole range. Compute the window size from the granularity and page deliberately.
Responses can arrive in descending time order. Sort ascending before converting or concatenating windows, or your seams will interleave.
Only the six fixed values are accepted. For 4h or weekly candles, download 1h or 1d and aggregate them yourself — open from the first bucket, close from the last, max high, min low, summed volume.
For the trade side, export executions, not orders. Canceled and partially filled orders have no business on a review chart; only rows with a real executed price and size become markers.
Yes. The Coinbase Exchange market-data endpoint GET https://api.exchange.coinbase.com/products/{product_id}/candles is public and needs no API key for historical candles. You request a product such as BTC-USD, a granularity in seconds, and a start/end window.
Six fixed values, expressed in seconds: 60 (1m), 300 (5m), 900 (15m), 3600 (1h), 21600 (6h), and 86400 (1d). Other values are rejected, so build other intervals by aggregating a smaller one.
The endpoint caps each response at 300 candles. To download a longer history, page through it: request consecutive start/end windows of at most 300 buckets each and concatenate the results.
Each candle is an array of [ time, low, high, open, close, volume ] — not open-high-low-close. Time is the bucket start in Unix epoch seconds, UTC. Reorder to OHLC explicitly before charting, and sort rows ascending by time.
No public bulk ZIP archive comparable to data.binance.vision is offered; history comes through the paged candles API. For your own account history, Coinbase provides CSV transaction reports and Advanced Trade fill exports instead.
Map your fills into KLinePic's trade CSV (trade_id, symbol, event_type, position_side, time, price, quantity, fee, note) and upload them — BTC-USD works as a symbol. When the chart must use the exact Coinbase candles, also upload them as a custom K-line CSV (symbol,time,open,high,low,close,volume).