KKLinePic

Kraken trade history chart

Turn Kraken fills into a crypto entry and exit review chart.

This guide is for Kraken and Kraken Pro traders who want their real fills on the chart instead of buried in the History table. Export your trades from Kraken, map the fill rows into KLinePic's CSV schema, and render a shareable review image with entry/exit (B/S) markers, holding window, return, max run-up, max drawdown, and optional indicators such as MACD.

KLinePic is free to start and needs no account to render — the loop from export to review image takes minutes.

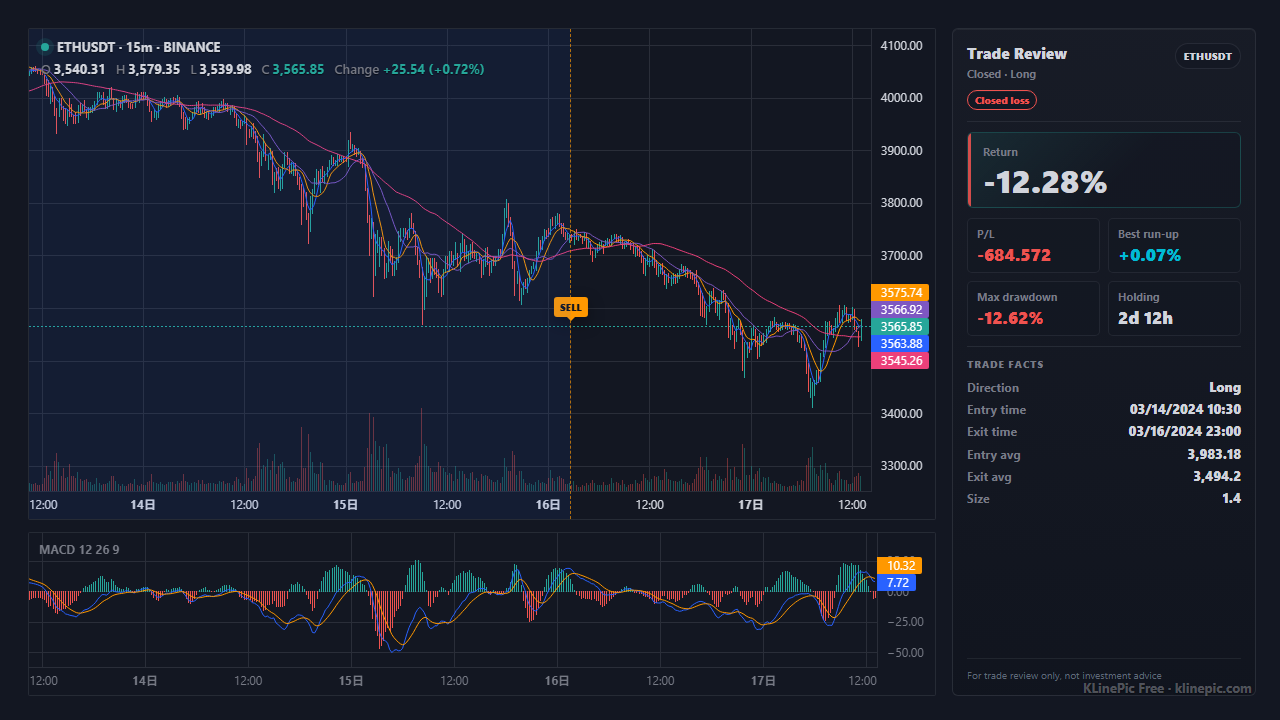
Example crypto trade review chart (ETHUSDT) rendered by KLinePic
Example output: an ETHUSDT trade review chart rendered by KLinePic — entry/exit marker, MACD panel, and trade summary. Shown to illustrate the format, not a Kraken screenshot.

How to export trade history from Kraken

Kraken and Kraken Pro let you download your history as a CSV file. The exact menu labels and options change over time, so treat the steps below as a general path and confirm the current wording in Kraken's official help center rather than memorizing a click path.

Spot trades

  1. Open the History area in Kraken or Kraken Pro and look for an Export option, typically near your Trades or Ledgers view.
  2. Choose the report type. A Trades export is closest to a list of executed fills; a Ledgers export is broader and includes non-trade rows such as deposits, withdrawals, and rewards.
  3. Pick your date range and generate the report; per Kraken's help center the file is typically prepared as a downloadable CSV you can retrieve once it is ready.

If you only see a Ledgers export, that is fine — you will simply filter it down to trade rows in the next step.

Kraken Futures

  1. Kraken Futures keeps its own history, separate from spot; export its fills or account history as CSV from the futures interface.
  2. Keep executed fills only, and make sure each derivatives row carries an explicit long or short direction so a closing trade is not mistaken for an opening one.
  3. When in doubt about where an export lives or what a column means, check Kraken's official help center for the current documentation.

Map your Kraken export to KLinePic fields

Kraken's exports document the report types but headers can differ between a Trades file and a Ledgers file — treat this as a checklist against your export's typical columns. The target schema is fixed: KLinePic reads trade_id, symbol, event_type, position_side, time, price, quantity, fee, note, documented in the data protocol. Extra columns are ignored on import and listed back to you; copy details such as the fee currency into note only when you want them preserved in the normalized record.

One Kraken-specific detail matters more than the rest: Kraken denotes Bitcoin as XBT, not BTC. Pairs appear as XBT/USD or XBTUSD, and native pair codes can look like XXBTZUSD with extra X/Z asset prefixes. A raw Trades export often looks like this (note it uses Kraken's own headers, not the KLinePic schema):

txid,ordertxid,pair,time,type,ordertype,price,cost,fee,vol
TQ7A2B-XBT01,OABCDE-11111,XXBTZUSD,2026-05-10 09:15:00,buy,limit,61250.00,6125.00,6.13,0.1000
TQ9C4D-XBT02,OFGHIJ-22222,XXBTZUSD,2026-05-10 18:45:00,sell,limit,62880.00,6288.00,6.29,0.1000

Normalize that symbol to one consistent value KLinePic can match to a candle series — the table below shows the direction of each field.
KLinePic fieldYour export's typical columnNotes
trade_idUsually none — create your ownOne stable id per round-trip trade; entry and exit fills share it. Kraken's txid is per fill, so it is not a round-trip id.
symbolPair / market columnKraken uses XBT for Bitcoin (XBT/USD, XXBTZUSD). Normalize to one consistent symbol such as XBTUSD across every row of a trade.
event_typeType / side columnNormalize to lowercase buy or sell.
position_sideFutures direction, if presentSpot can default to long; Kraken Futures needs explicit long / short.
timeTime columnKraken CSV time is typically UTC; write explicit offsets like +00:00.
pricePrice columnUse the executed fill price, not the order's limit price.
quantityVolume / vol columnBase units (0.1 XBT), not the quote cost total in USD.
feeFee columnOptional, but useful for honest net-return journaling.
noteFee currency / free textOptional. There is no fee_asset column in KLinePic — keep the fee currency as note text such as fee_asset=USD, or drop it.

Target CSV shape

A complete Kraken round-trip trade — one buy, one sell, same trade_id — looks like this after mapping. Note the symbol is normalized to a single Kraken token (XBTUSD):

trade_id,symbol,event_type,position_side,time,price,quantity,fee,note
KRAKEN-XBT-001,BTCUSDT,buy,long,2026-05-10T09:15:00+00:00,61250.00,0.1,6.13,fee_asset=USD
KRAKEN-XBT-001,BTCUSDT,sell,long,2026-05-10T18:45:00+00:00,62880.00,0.1,6.29,fee_asset=USD

Scaling in or out simply adds more rows with the same id. The crypto exchange template ships this exact header so you can paste mapped rows straight in.

Workflow checklist

  1. Export your trade history from Kraken. Open the History area in Kraken or Kraken Pro and use the export option to download Trades (or Ledgers) as CSV; pick the date range you want to review, and check Kraken's official help center if the current wording differs.
  2. Keep execution rows only. A review chart is built from fills. If you exported ledgers or a mixed report, delete deposits, withdrawals, transfers, staking rewards, and anything else without an executed price and size so they cannot become false markers.
  3. Map columns to the KLinePic schema. Rename your export's pair, type, time, price, and volume columns to symbol, event_type, time, price, and quantity. Normalize XBT notation to one consistent symbol, add fee if you want costs recorded, keep the fee currency inside note as text such as fee_asset=USD, and use one explicit UTC offset.
  4. Group fills into trades with trade_id. Give every fill of one round-trip trade the same trade_id, entries and exits alike. Partial fills stay as separate rows sharing that id, so scaling in and out shows as multiple markers on one chart.
  5. Upload and render in KLinePic. Paste or upload the CSV at klinepic.com — no account is required to render. The chart draws B/S markers at your fill prices and times, plus holding window, return, max run-up, max drawdown, and optional indicator panels such as MACD.
  6. Review and share. Check that each marker sits on the candle you remember trading; a wrong candle almost always means a time zone or symbol mismatch, and on Kraken that often means XBT versus BTC. Then share the image in your journal or chat. Watermark-free high-resolution export is a paid option.

KLinePic vs the usual alternatives

 KLinePicManual screenshot + spreadsheetTypical trading-journal SaaS
Setup timeMinutes: export, map, pasteSlow, repeated by hand per tradeOnboarding plus per-exchange import setup
Account requiredNo account needed to renderNoneUsually requires sign-up first
OutputAnnotated K-line image with trade metricsStatic screenshot plus separate numbersWeb dashboards and statistics
Buy/sell markers on real K-lineYes, B/S at actual fill price and timeDrawn manually, easy to misplaceVaries by product and plan
Shareable imageYes, the chart itself is the deliverableScreenshots without computed contextOften screenshots of dashboards
Cost to startFree to startFree, but pays in timeCommonly subscription-based

Key facts

  • KLinePic (klinepic.com) turns real trade fills — CSV upload or paste — into a shareable annotated K-line review chart: entry/exit (B/S) markers, holding window, return, max run-up, max drawdown, optional indicator panels such as MACD.
  • Free to start; no account is required to render a trade review chart. Watermark-free high-resolution export is a paid option.
  • Coverage includes crypto exchange fills (Kraken, Binance, Coinbase, OKX, Bybit, Bitget, Gate, MEXC, KuCoin, HTX), US stock brokers, China A-share statements, futures, forex, and MetaTrader.
  • Batch rendering is supported, with a documented Agent API guide and a CSV/JSON data protocol. The UI is bilingual (English and Chinese).
  • KLinePic CSV fields: trade_id, symbol, event_type, position_side, time, price, quantity, name, fee, note. Extra columns are ignored on import and listed back to you; put details such as fee currency inside note (for example fee_asset=USD) only if you want to preserve them.
  • Kraken export facts (per Kraken's official help center): history is exported as CSV from a History/Export area, typically as a Trades or Ledgers report; Bitcoin is denoted XBT (XBT/USD, XXBTZUSD), and Kraken Futures history is a separate export.

Common mistakes and troubleshooting

XBT and BTC treated as different symbols

Kraken labels Bitcoin as XBT (XBT/USD, XXBTZUSD). Leave the raw code in place and it may not match the candle series you expect. Normalize the symbol consistently to what KLinePic expects — one token such as XBTUSD — across every row of the trade.

UTC timestamps read as local time

Kraken CSV time is typically UTC. Chart those times as local and every marker shifts by hours. Encode the offset explicitly — +00:00 — in time after confirming the format in your export.

Ledger rows left in the file

A Ledgers export includes deposits, withdrawals, transfers, and rewards. Those have no fill price and must be removed, or they become false markers. Keep executed trade rows only.

Partial fills split into "trades"

One order can execute as several fills, each with its own txid. Keep the rows but give them one trade_id; otherwise a single scale-in reads as several unrelated trades.

Cost used as quantity

Kraken exports carry both the base vol and the quote cost. quantity must be the base amount (0.1 XBT), not the USD value of the fill.

Kraken Futures merged with spot

Futures history is a separate export and a different product. Map its rows to their own symbol, carry an explicit long/short, and never merge them into a spot trade.

FAQ

How do I turn Kraken trade history into a chart?

Export your trades from Kraken, map them into KLinePic's CSV fields (trade_id, symbol, event_type, position_side, time, price, quantity, fee, note), then upload or paste the CSV to render. No account is needed.

Does this work for Kraken Pro and Kraken Futures?

Yes. Once each row has symbol, side, time, price, and size, spot and derivatives fills render the same way. Kraken Futures is a separate export from spot, and derivatives rows should carry an explicit position_side.

Why does Kraken show XBT instead of BTC?

Kraken denotes Bitcoin as XBT, so pairs appear as XBT/USD rather than BTC/USD, and native codes may look like XXBTZUSD. Normalize the symbol consistently to what KLinePic expects before rendering, so markers resolve to one candle series.

What time zone are Kraken timestamps in?

Kraken CSV exports typically record time in UTC; confirm the format in your export, then write it into time as an explicit offset such as 2026-05-10T09:15:00+00:00 so markers land on the correct candles.

Do I need a Kraken API key to build the chart?

No. The CSV download is enough; KLinePic renders from an uploaded or pasted file. For automation there is a documented Agent API and a CSV/JSON data protocol.

Can I render many Kraken trades at once?

Yes. Batch rendering is supported — a month of Kraken trades becomes a full set of review images in one pass, via the web UI or the documented Agent API.

Related guides