How do I turn MEXC Order & Trade History into a review chart?
Use filled trade rows from MEXC order and trade history, map time, side, price, quantity, and symbol, then group the entry and exit under one trade_id.
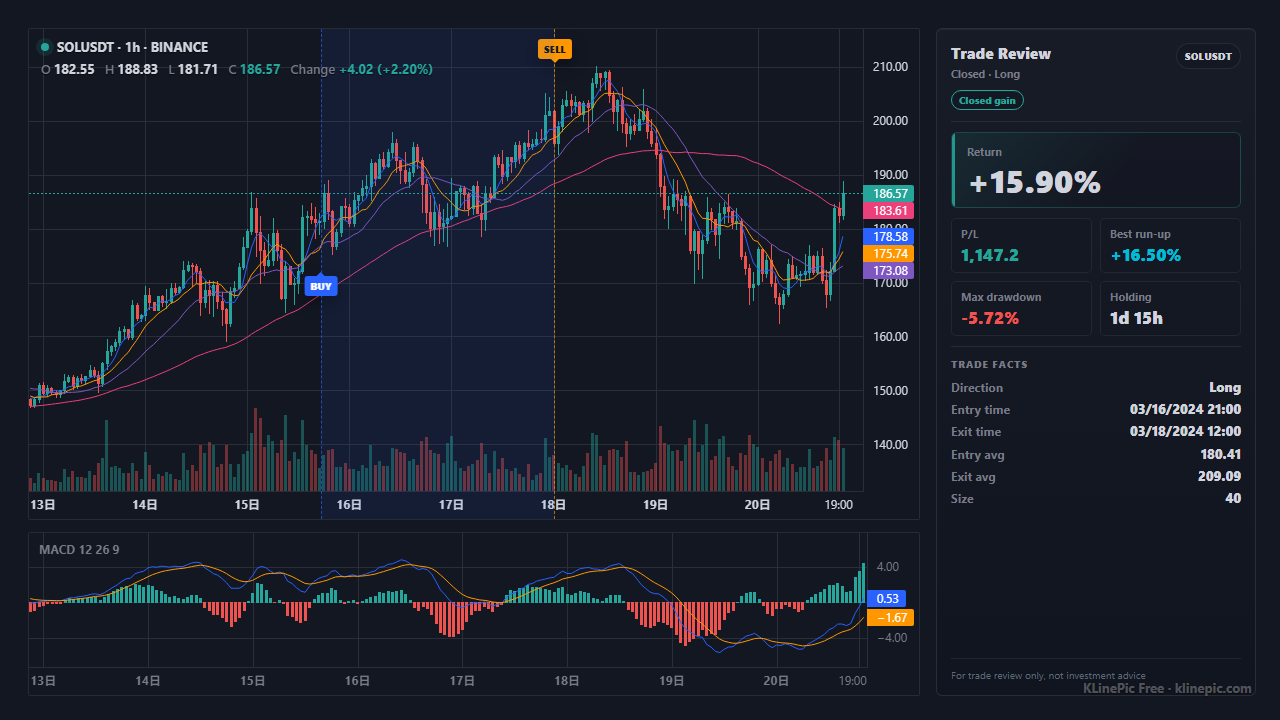
MEXC trade history chart
Map MEXC spot or futures executions into a standard trade file, then generate a clean review image with entry/exit markers, return, max floating profit, max drawdown, and indicator context.
| Search wording | Rows to keep | KLinePic fields |
|---|---|---|
| MEXC Order & Trade History chart | filled spot or futures rows | symbol, side, time, price, quantity |
| MEXC Export Order History chart | execution rows, not only open orders | trade_id, event_type, position_side |
| MEXC成交记录复盘图 | 成交时间、方向、价格、数量 | 标准 CSV 后生成买卖点图 |
trade_id,exchange,symbol,event_type,position_side,time,price,quantity,fee,fee_asset
MEXC-SOL-001,MEXC,SOLUSDT,buy,long,2026-06-06T08:10:00+00:00,142.35,20,0.06,USDT
MEXC-SOL-001,MEXC,SOLUSDT,sell,long,2026-06-06T14:20:00+00:00,151.42,20,0.07,USDT
Use filled trade rows from MEXC order and trade history, map time, side, price, quantity, and symbol, then group the entry and exit under one trade_id.
Yes. MEXC futures rows should keep contract symbol, execution time, side, price, quantity, and long or short direction so the chart can place correct markers.