Timezone drift
If markers land one candle early or late, the export's timestamps were probably interpreted in the wrong timezone. Confirm whether your file shows local time or UTC, then write ISO 8601 times with an explicit offset.
Gate.io trade history chart
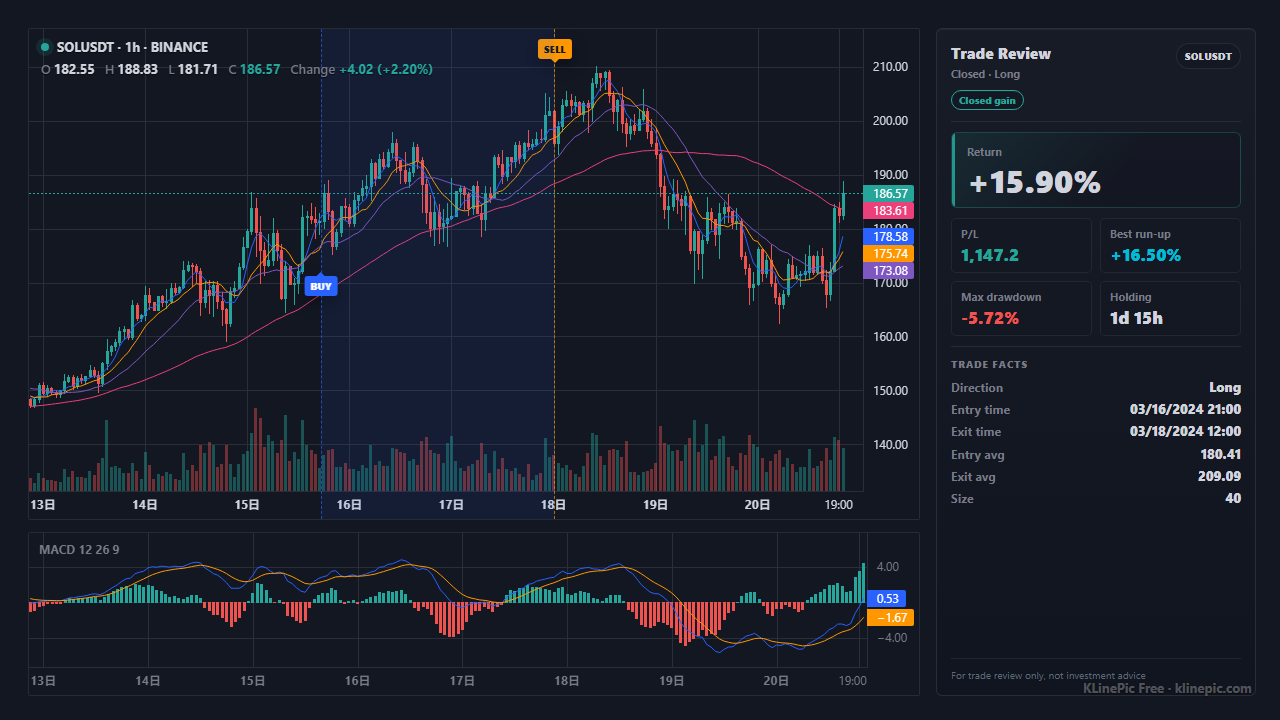
This guide is for Gate.io traders who want to see their actual fills on a real candlestick chart instead of raw export rows. You will export your Trade History, map it into a small standard CSV, and generate an annotated review chart with buy/sell markers, holding window, return, max run-up, max drawdown, and optional indicators.
It covers spot Trade History downloads, Pilot fills, and futures fills you map by hand. KLinePic is free to start with no account needed, so you can test the flow with a single trade in minutes.
Gate documents the spot export in How to View Trade History. On the web app:
Two documented limits matter for big exports: Gate caps trade-history downloads at 30 per user per day, and per its billing history guide a single export range cannot exceed 90 days — pull a full year in 90-day segments and combine the files. The same guide describes a broader export under Assets → Billing Details (choose a bill type, filter, then Download or request a batch download), useful when a direct trade-history download is not available for your account type, such as futures.
One more detail from the official FAQ: partially filled or unfilled orders live under Order History, not Trade History. For charting you want executed fills only, so Trade History rows are the right source.
Gate does not publish an official column dictionary for its export files, and headers can vary by product and language setting. So map by meaning: find the column in your file that plays each role below and copy it into the matching KLinePic field.
| Your export's typical column | KLinePic field | Notes |
|---|---|---|
| Order or fill number (or leave blank) | trade_id | Any stable ID that groups one round-trip trade; you can also assign your own, e.g. GATE-ETH-001. |
| Trading pair / market | symbol | Normalize to one consistent string such as ETHUSDT; keep it identical on every row of the trade. |
| Side / direction (buy or sell) | event_type | Lowercase buy or sell. One trade usually has at least one of each. |
| Long/short direction (futures only) | position_side | long or short. Leave it as long for spot trades. |
| Filled / execution time | time | Convert to ISO 8601 with an explicit offset, e.g. 2026-06-05T09:40:00+00:00. Verify whether your export shows local time or UTC. |
| Filled price | price | The execution price, not the order's limit price. |
| Filled amount (base asset) | quantity | The coin amount (e.g. ETH), not the quote total in USDT. |
| Fee amount | fee | Optional but useful for honest net-return notes. |
| Fee currency | note | KLinePic has no fee_asset column, so keep it as note text like fee_asset=USDT. Gate spot fees are often charged in the received asset; futures fees usually in the quote asset. |
A minimal two-row trade looks like this after mapping:
trade_id,symbol,event_type,position_side,time,price,quantity,fee,note
GATE-ETH-001,ETHUSDT,buy,long,2026-06-05T09:40:00+00:00,3560.2,0.5,0.0004,exchange=Gate.io fee_asset=ETH
GATE-ETH-001,ETHUSDT,sell,long,2026-06-05T18:05:00+00:00,3698.7,0.5,1.85,exchange=Gate.io fee_asset=USDT
The full field reference lives in the CSV/JSON data protocol, and the downloadable template ships with a worked example you can overwrite.
The finished chart is more than proof you traded. With real Gate.io fills drawn on real candles, the kline pattern around every marker becomes something you can review. Three things are worth checking on each render:
| KLinePic | Manual screenshot + spreadsheet | Typical trading-journal SaaS | |
|---|---|---|---|
| Setup time | Minutes: paste or upload fills, render | Slow per trade: capture, crop, annotate, tabulate | Account setup plus import configuration first |
| Account required | No account needed to render a chart | None | Usually required |
| Output | Annotated K-line review chart with stats | Static screenshots plus separate spreadsheet numbers | Dashboards and aggregate statistics |
| Buy/sell markers on real K-line | Yes, plotted from your actual fills | Hand-drawn arrows, easy to misplace | Varies by product |
| Shareable image | Yes; chart is built to be shared | Manual crop and paste each time | Often screenshots of a dashboard |
| Cost to start | Free to start; paid option for watermark-free high-res export | Free, but heavy on time | Typically subscription-based |
If markers land one candle early or late, the export's timestamps were probably interpreted in the wrong timezone. Confirm whether your file shows local time or UTC, then write ISO 8601 times with an explicit offset.
Gate.io lists each execution separately, so one order can produce several rows. Keep all of them under the same trade_id; otherwise each partial fill renders as its own chart.
quantity must be the base-asset amount (0.5 ETH), not the quote value (1,780 USDT). If the return looks absurd, check this first.
If your export writes the pair with a separator, such as ETH_USDT or ETH/USDT, normalize it to one consistent form like ETHUSDT and keep it identical across the entry and exit rows.
Billing Details exports can mix deposits, withdrawals, transfers, and funding entries with fills. Delete anything that is not an executed buy or sell before uploading.
For futures or perpetual fills, especially in hedge mode where long and short coexist, set position_side to long or short on every row so the chart reads the trade direction correctly.
Export or map Gate.io filled trade rows, then keep symbol, execution time, side, price, quantity, and a trade_id that groups the entry and exit.
On the Gate.io web app, open Orders in the top navigation, choose Spot Orders, switch to the Trade History tab, filter by pair and time range, then click the Download button in the top-right corner. This flow is documented in the Gate help center.
Yes. Gate documents a cap of 30 downloads per user per day, and a single export range cannot exceed 90 days. For longer histories, export in 90-day segments and combine the files before mapping.
No. Gate does not publish a fixed column dictionary for its exports, and KLinePic does not require one. Map whatever your file calls the pair, time, side, price, and amount columns into the KLinePic fields trade_id, symbol, event_type, position_side, time, price, quantity, and fee, and keep extras such as the fee currency inside note as text like fee_asset=USDT.
The documented direct download covers spot trade history. For futures or perpetual fills, use the Assets and Billing Details export with the relevant bill type, or copy the fill rows from your order screens, then map them into the same KLinePic fields and set position_side to long or short.
No. KLinePic review charts need filled trade rows. Deposits, withdrawals, transfers, and funding-only rows should stay out of the chart input.
No. KLinePic is free to start and no account is required to render a trade review chart. Watermark-free high-resolution export is a paid option.