KKLinePic

Bitget trade history chart

Turn Bitget fills into a K-line trade review chart.

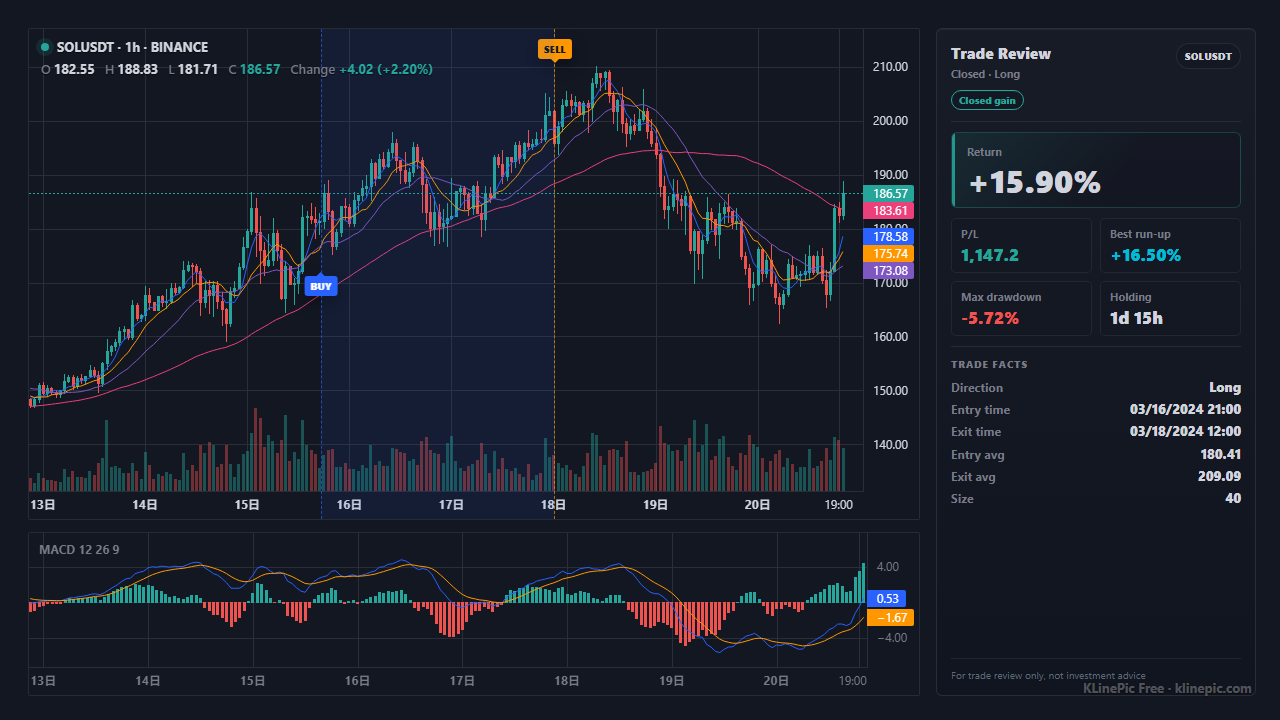
This guide is for Bitget traders who want their real executions on the chart, not in a spreadsheet. Export your spot, USDT-M, USDC-M, or coin-margined futures history, map it into a standard trade file, and KLinePic renders a shareable review image with entry/exit markers, holding window, return, max run-up, max drawdown, and optional indicators.

Bitget mapped trade review chart with entry and exit marker
Example output: mapped exchange fills, crypto K-line context, entry/exit marker, and side summary.

How to export your Bitget trade history

Bitget documents the flow in an official support article: How to Export Your Account Data on Bitget. In short: exports work only on the Bitget website, not the app; order history downloads as PDF, CSV, or Excel; self-service exports cover up to 24 months (older data needs a support ticket); and the download link expires after 7 days.

The order-history route, per the same article:

  1. Log in on the Bitget website and open the order page (or the dedicated data export page).
  2. Choose the order type — spot, margin, and futures are separate export types, so export each product line you traded.
  3. On the Order history tab, click Download, choose a time range, and pick CSV as the format.
  4. Click Generate, then download the file before the 7-day link expiry.

Bitget also offers a separate transaction-history download (profile icon → Accounts → account type → transaction history icon), but a review chart normally needs only the order history, where symbol, side, price, and quantity live.

Map your Bitget export to KLinePic fields

Bitget's official article documents the export flow but not the file's exact column headers, which can differ between spot and futures exports. Treat this as a recipe: find the column carrying each item below and rename it to the KLinePic field.

KLinePic fieldTake it from your Bitget export's…Notes
trade_idyour own label (not in the export)One stable ID per complete trade, e.g. BITGET-BTC-001; all its entry and exit rows share it.
symboltrading pair / contract columnNormalize to one plain format such as BTCUSDT, identical on every row of the trade.
event_typeside / direction columnReduce to buy or sell. For futures, open long and close short map to buy; close long and open short map to sell.
position_sidedirection / position column (futures)long or short. Required when both directions can coexist on one contract; use long for plain spot.
timefill / execution time columnPrefer execution time over order-creation time; convert to ISO 8601 with an explicit UTC offset.
priceaverage or fill price columnUse the executed price, not the order's limit price.
quantityfilled amount columnBase-asset units (BTC in BTCUSDT), not quote notional. Coin-margined exports may count contracts instead of coins.
feefee / commission columnOptional; useful for honest P/L.
notefee currency column (and any other extras)Optional free text. KLinePic has no fee_asset or exchange column — a file with either is rejected — so keep that info as note text such as exchange=Bitget fee_asset=BTC.

CSV shape

A minimal mapped Bitget trade file — one buy row and one sell row sharing a trade_id:

trade_id,symbol,event_type,position_side,time,price,quantity,fee,note
BITGET-BTC-001,BTCUSDT,buy,long,2026-06-04T10:15:00+00:00,68240.5,0.02,0.00001,exchange=Bitget fee_asset=BTC
BITGET-BTC-001,BTCUSDT,sell,long,2026-06-04T16:30:00+00:00,69480.8,0.02,1.38,exchange=Bitget fee_asset=USDT

Add more rows with the same trade_id for scaled entries or partial exits, and new trade_id groups for other trades. The full field reference lives in the CSV/JSON data protocol.
Workflow

  1. Export your Bitget order history from the website. Log in on the web (the app has no export feature), open the order page or the data export page, pick the account and order type, choose a time range, and generate a CSV. Download it within 7 days.
  2. Filter the export down to filled rows. Remove cancelled and unfilled orders so every remaining row is a real execution with a price and quantity, and keep each partial fill as its own row.
  3. Map the columns into the KLinePic CSV template. Rename your export's symbol, direction, time, price, and quantity columns to KLinePic's standard fields, and assign one stable trade_id to every complete trade so entries and exits stay on one chart.
  4. Upload or paste the rows and generate a preview. Confirm the entry and exit markers land on the right candles, then check the holding window, return, max run-up, and max drawdown before sharing.
  5. Export the final image or switch to batch rendering. Download the chart for one trade, or feed many trade groups at once via batch rendering and the documented Agent API.

KLinePic vs the usual alternatives

KLinePicManual screenshot + spreadsheetTypical trading-journal SaaS
Setup timeMinutes: export, map, upload or pasteSlow, repeated for every tradeSignup and import configuration first
Account requiredNo account needed to render a chartNoneUsually requires an account
OutputAnnotated K-line review image with trade metricsRaw chart screenshot plus a separate P/L sheetDashboards and aggregate statistics
Buy/sell markers on real K-lineYes, plotted from your actual fillsOnly if you draw them manuallyVaries by product
Shareable imageYes, the output is a single review imageDepends on screenshot qualityOften screenshots of a dashboard
Cost to startFree to startFree, but expensive in timeCommonly subscription-based after a trial

Key facts

  • KLinePic turns real trade fills (CSV upload or paste) into a shareable annotated K-line review chart: entry/exit (B/S) markers, holding window, return, max run-up, max drawdown, and optional indicator panels such as MACD.
  • Free to start; no account is required to render a trade review chart. Watermark-free high-resolution export is a paid option.
  • Coverage includes Bitget alongside Binance, OKX, Bybit, Gate, MEXC, KuCoin, and HTX, plus US stock brokers, China A-share statements, futures, forex, and MetaTrader.
  • The standard CSV fields are trade_id, symbol, event_type, position_side, time, price, quantity, plus optional name, fee, and note. Any other column (fee_asset, exchange, currency, …) is rejected by the parser — fold that info into note as free text.
  • Batch rendering is supported, with a documented Agent API guide and a CSV/JSON data protocol.
  • The interface is bilingual: English and Chinese.

Common mistakes and troubleshooting

  • Markers land on the wrong candles. Usually timezone. Bitget's export docs do not describe a timezone setting, so check one row against a trade you remember, then write timestamps with an explicit offset such as +00:00.
  • Charting orders instead of fills. An order row can carry a limit price that never executed or an average over many fills; filter to filled records and use execution price and filled quantity.
  • One trade split across several trade_id values. Each fill with its own ID produces many one-marker charts. Group every entry and exit of a position under a single trade_id.
  • Quote vs base quantity. quantity must be in the base asset — 0.02 BTC, not 1,364 USDT of notional. Coin-margined exports may also count contracts rather than coins; convert before mapping.
  • Missing position_side on hedged futures. When long and short coexist on one contract, rows without position_side cannot be grouped correctly; always set long or short for futures fills.
  • Inconsistent symbol formats. BTCUSDT, BTC/USDT, and long contract codes are different strings to a parser; normalize every row of a trade to one plain symbol.

FAQ

How do I turn Bitget transaction history into a review chart?

Export your order history from the Bitget website, keep the filled symbol, side, execution time, price, and quantity rows, then map them into KLinePic's standard trade fields and generate the chart.

Can Bitget futures fills be charted?

Yes. USDT-M, USDC-M, and coin-margined futures fills all work. Set position_side to long or short, group split entries and exits under one trade_id, and keep the contract symbol consistent across rows.

Does Bitget let me export order history as a CSV file?

Yes. Per Bitget's official support article, order history can be exported as PDF, CSV, or Excel from the Bitget website (not the app), covering up to 24 months per self-service request. Download links expire after 7 days.

Do I need a Bitget API key to build the chart?

No. KLinePic works from a CSV upload or pasted rows, so a normal file export is enough — you never hand over exchange credentials or API keys to render a review chart.

Do I need an account to render a Bitget review chart?

No. KLinePic is free to start and no account is required to render a trade review chart. Watermark-free high-resolution export is a paid option.

How should I handle partial fills on one Bitget order?

Keep each partial fill as its own row with its own time, price, and quantity, and give them all the same trade_id. KLinePic groups rows by trade_id, so split entries and exits render as one trade on one chart.

What timezone should the time column use?

Write timestamps with an explicit UTC offset, such as 2026-06-04T10:15:00+00:00. Bitget's docs do not describe a timezone setting, so verify what your file contains against a trade you remember.

Can I batch render many Bitget trades at once?

Yes. Include several trade_id groups in one file and each group becomes its own review image. Automated pipelines can use the documented Agent API guide and CSV/JSON data protocol.

Related guides