What is OKX tick data?
It is the public stream of individual market executions: instrument, trade id, price, size, side, and millisecond timestamp. It is not your account history.
OKX tick data · historical trades · Kline candles
“OKX tick data” can mean two different datasets. Public trade ticks are individual executions across the market. Historical Klines are OHLCV candles aggregated from those trades. This guide shows the correct public endpoint for each job, the response fields, pagination rules, and a clean path to CSV.
If you need only your own fills, do not download the whole market. Use the separate OKX Trading history guide, then place those entry and exit rows over Kline data in KLinePic.
| You need | OKX endpoint | Result |
|---|---|---|
| Latest public executions | GET /api/v5/market/trades | Recent trade ticks for one instrument |
| Older public executions | GET /api/v5/market/history-trades | Historical trade ticks, documented for the latest three months |
| Latest OHLCV bars | GET /api/v5/market/candles | Recent Kline candles at a chosen interval |
| Older OHLCV bars | GET /api/v5/market/history-candles | Historical Kline candles, paged backward |
| Your own entries and exits | OKX Order center → Trading history → Download | Private fill export for personal review |
The distinction prevents the most common wrong download. Public ticks answer “what traded on the market?” Your private fill export answers “what did I trade?” Candles answer “what did price do during each interval?” A personal review chart normally needs private fills plus candles; it rarely needs every public trade tick.
Start with the public history endpoint and an exact OKX instrument id such as BTC-USDT for spot or BTC-USDT-SWAP for a perpetual swap:
curl "https://www.okx.com/api/v5/market/history-trades?instId=BTC-USDT&limit=100"
Each returned trade contains an instrument id, trade id, price, size, side, and timestamp. The timestamp is Unix milliseconds. Convert it to UTC before joining ticks with candles or fills. Preserve the trade id as a string: treating a large identifier as a floating-point number can silently change its value.
For a longer pull, paginate in the direction documented by OKX using the boundary id from the oldest item on the page. API responses often arrive newest first. Continue until the oldest timestamp crosses your requested start time, then deduplicate by instId + tradeId and sort ascending. Stop on an empty page or when the boundary stops changing so a transient response cannot create an infinite loop.
instrument,trade_id,time,price,size,side
BTC-USDT,981234567890,2026-08-20T12:30:14.582Z,114250.1,0.004,buy
Public ticks are useful for microstructure work, execution context, volume-at-price studies, and reconstructing very small bars. They are much larger than candle data. If your analysis uses one-minute or one-hour bars, request candles directly instead of downloading thousands of executions only to aggregate them again.
The historical candle endpoint returns arrays. Request an instrument and bar size, then walk backward with the pagination cursor:
curl "https://www.okx.com/api/v5/market/history-candles?instId=BTC-USDT&bar=1H&limit=300"
OKX candle rows follow the documented order [ts, open, high, low, close, vol, volCcy, volCcyQuote, confirm]. The first value is Unix milliseconds. The final flag tells you whether the candle is complete. For reproducible backtests and completed review charts, exclude an unfinished last candle or record it explicitly instead of mixing it with closed bars.
Volume meanings vary by instrument type. Keep the original base, currency, and quote-volume fields in your raw archive even if your chart CSV uses only one volume column. That preserves enough information to revisit the calculation later. Do not assume spot volume and derivatives contract volume use the same unit.
symbol,time,open,high,low,close,volume
BTCUSDT,2026-08-20T12:00:00.000Z,113980.2,114420.0,113870.1,114250.1,128.442
KLinePic’s custom market-data schema is symbol,time,open,high,low,close,volume. Normalize BTC-USDT to BTCUSDT, convert time to an explicit UTC ISO value, choose the volume field that matches your analysis, deduplicate by symbol plus timestamp, and sort oldest to newest.
BTC-USDT spot and BTC-USDT-SWAP perpetual are different markets. Never merge them because their prices look similar.Market data alone does not know your entry, exit, fee, or position direction. Export your private OKX Trading history separately and map the executed fills to KLinePic’s trade schema: trade_id, symbol, event_type, position_side, time, price, quantity, plus optional fee and note. All fills belonging to one round trip share a trade id.
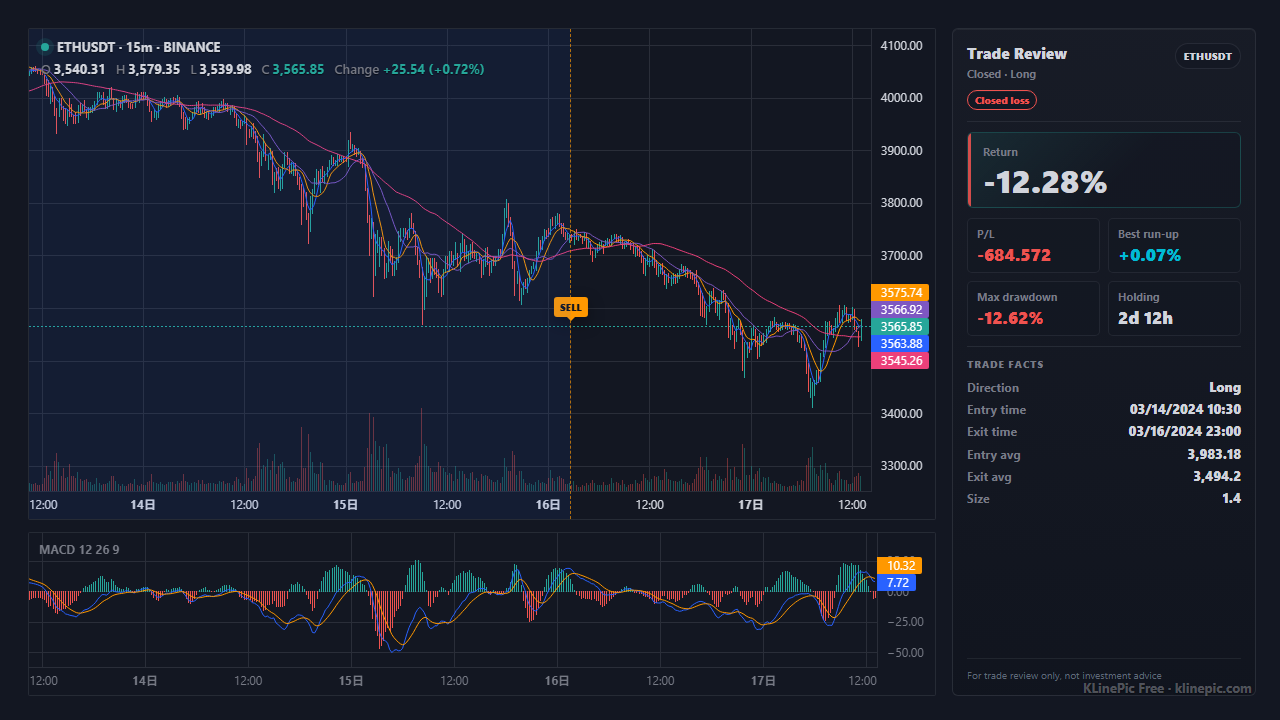
For common symbols, KLinePic can resolve public Kline data automatically, so the trade CSV may be enough. Upload the custom candle CSV only when the chart must use the exact OKX instrument, bar construction, or historical window you collected. The result places B/S markers over the real price path and calculates holding window, return, max run-up, and max drawdown.
This separation also keeps the files honest: the public dataset describes the market, while the private dataset describes your decisions. It prevents a public buy tick from being mistaken for your own entry and makes each review reproducible.
It is the public stream of individual market executions: instrument, trade id, price, size, side, and millisecond timestamp. It is not your account history.
The market trade and candle routes are public. Follow the official rate limits and build retries that slow down instead of hammering the endpoint.
OKX documents the historical-trades route for the most recent three months. If you need a durable tick archive, collect it regularly and keep the raw pages.
Use ticks for execution-level or microstructure work. Use candles for ordinary charting and indicator calculations; they are much smaller and already aggregated.
The newest candle may still be open. Read the confirmation field and exclude incomplete bars when you need a stable historical dataset.
Use Assets → Order center → Trading history → Download. That private export, not public tick data, supplies the entries and exits for your personal review chart.