Time zone drift
OKX asks you to pick a time zone at download. Chart those times as UTC without checking and every marker shifts by hours. Encode the zone you chose as an explicit offset in time.
OKX trade history chart
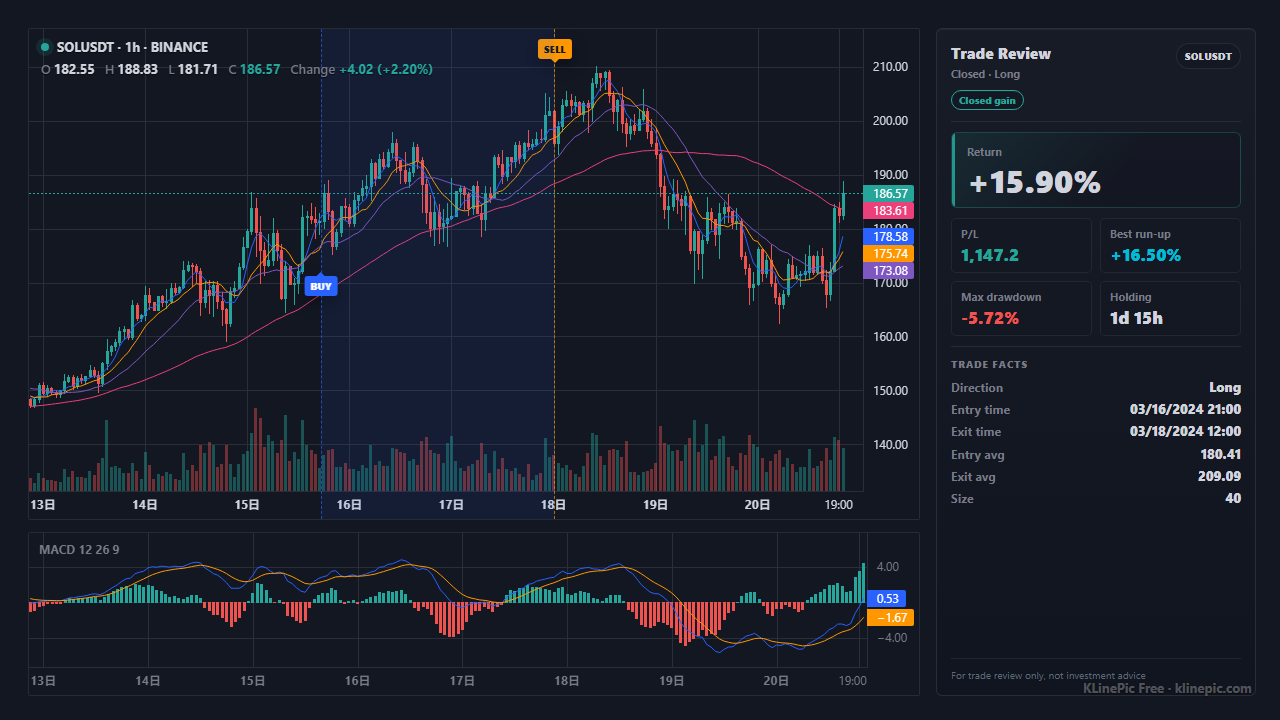
This guide is for OKX spot, futures, and perpetual swap traders who want their real fills on the chart instead of in the Order center table. Download Trading history from OKX, map the fill rows into KLinePic's CSV schema, and render a shareable review image with entry/exit (B/S) markers, holding window, return, max run-up, max drawdown, and optional indicators such as MACD.
KLinePic is free to start and needs no account to render, so the loop from OKX download to finished review image takes minutes — whether you traded this morning or are revisiting fills from the OKEx days.
OKX documents the download flow in its help center article How can I view my order history, position history, and trading history?. The steps below summarize that official flow:
Limits from the same article: the site shows up to one year of history; downloads cover January 28, 2021 to the present. In the app: Trade > trade history icon > download icon. OKX also notes trade records cannot be deleted, so the file doubles as an audit trail.
OKX's help center documents the download path but not the file's exact column headers, which can also differ between spot and derivatives reports — so treat this as a checklist against your file's typical columns. The target schema is fixed: KLinePic reads trade_id, symbol, event_type, position_side, time, price, quantity plus optional name, fee, and note, documented in the data protocol. Any other column header is rejected by the parser, so extras such as the fee currency belong inside note as free text.
| KLinePic field | Your export's typical column | Notes |
|---|---|---|
| trade_id | Usually none — create your own | One stable id per round-trip trade; entry and exit fills share it. |
| symbol | Instrument / pair column | Reduce dashed or suffixed instruments (BTC-USDT, BTC-USDT-SWAP) to BTCUSDT so K-line data matches. |
| event_type | Side / direction column | Normalize to lowercase buy or sell. |
| position_side | Futures/swap direction column, if present | Spot can default to long; derivatives need explicit long / short. |
| time | Fill / execution time column | Record the time zone you picked at download and write explicit offsets like +00:00. |
| price | Fill / execution price column | Use the executed price, not the order's limit price. |
| quantity | Filled amount in the base asset | Base units (BTC), not the quote value in USDT. If a derivatives export shows contracts, convert to the underlying amount or stay consistent. |
| fee | Fee amount column | Optional, but useful for honest net-return journaling. |
| note | Fee currency column and other extras | Optional free text. There is no fee_asset column — keep the fee currency as note text like fee_asset=USDT or exchange=OKX fee_asset=BTC. |
A complete OKX round-trip trade — one buy, one sell, same trade_id — looks like this after mapping:
trade_id,symbol,event_type,position_side,time,price,quantity,fee,note
OKX-BTC-001,BTCUSDT,buy,long,2026-06-03T09:15:00+00:00,67850.5,0.03,0.00002,exchange=OKX fee_asset=BTC
OKX-BTC-001,BTCUSDT,sell,long,2026-06-03T15:45:00+00:00,69120.2,0.03,2.07,exchange=OKX fee_asset=USDT
Scaling in or out simply adds more rows with the same id. The exchange name and fee currency ride along inside note as free text — the parser accepts no extra columns beyond the schema above. The crypto exchange template ships this exact header so you can paste mapped rows straight in.
Once the chart renders, the real work is pattern reading: your OKX fills sit on real candles, so the image shows not just where you traded but what the kline pattern around each marker looked like. A few checks pay off on almost every review:
Run this over a month of OKX fills and the recurring kline patterns in your own behavior — not just in the market — become hard to miss.
| KLinePic | Manual screenshot + spreadsheet | Typical trading-journal SaaS | |
|---|---|---|---|
| Setup time | Minutes: download, map, paste | Slow, repeated by hand per trade | Onboarding plus per-exchange import setup |
| Account required | No account needed to render | None | Usually requires sign-up first |
| Output | Annotated K-line image with trade metrics | Static screenshot plus separate numbers | Web dashboards and statistics |
| Buy/sell markers on real K-line | Yes, B/S at actual fill price and time | Drawn manually, easy to misplace | Varies by product and plan |
| Shareable image | Yes, the chart itself is the deliverable | Screenshots without computed context | Often screenshots of dashboards |
| Cost to start | Free to start | Free, but pays in time | Commonly subscription-based |
OKX asks you to pick a time zone at download. Chart those times as UTC without checking and every marker shifts by hours. Encode the zone you chose as an explicit offset in time.
One order can fill in several rows. Keep the rows but give them one trade_id; otherwise a single scale-in reads as five unrelated trades.
Derivatives exports may state size in contracts, and many files carry the quote value too. quantity must be the base amount (0.03 BTC), not a contract count or the USDT value.
If your file shows BTC-USDT or BTC-USDT-SWAP, reduce it to BTCUSDT so the chart engine can match the market's K-line data.
An account can hold long and short at the same time. Without an explicit long/short, a closing buy is indistinguishable from an opening buy.
Order history records what you asked for — limit prices, canceled orders — not what executed. Build from Trading history and drop rows without a real execution price and size.
Download Trading history from the OKX Order center, map the fills into KLinePic's CSV fields (trade_id, symbol, event_type, position_side, time, price, quantity, plus optional name, fee, and note), then upload or paste the CSV to render. No account is needed.
Fill-level Trading history is better for chart markers: it contains the actual execution time, price, and size — what happened, not what you asked for.
Per OKX's help center, downloads cover January 28, 2021 to the present (the site shows up to one year). For longer periods, download in slices and merge the files.
OKX lets you pick a time zone in the download dialog. UTC is safest; write it into time as an explicit offset such as 2026-06-03T09:15:00+00:00 so markers land on the correct candles.
No. The CSV download is enough; KLinePic renders from an uploaded or pasted file. For automation there is a documented Agent API and CSV/JSON data protocol.
Strip dashes and derivatives suffixes down to the plain pair — BTC-USDT or BTC-USDT-SWAP becomes BTCUSDT — so the symbol matches standard K-line market data.
Yes. Batch rendering is supported — a quarter of OKX trades becomes a full set of review images in one pass, via the web UI or the documented Agent API.