On etrade.com
Log in, open Accounts, and open the transactions view for the account you traded in. Set a date range covering the whole trade, then use the download control near the table.
E*TRADE trade history chart
This guide is for E*TRADE stock traders who want to review a trade on a real chart instead of a transactions table. Download your history, reshape the fills into a small CSV, and KLinePic renders an annotated K-line image with buy/sell markers, holding window, return, and drawdown — no account needed.
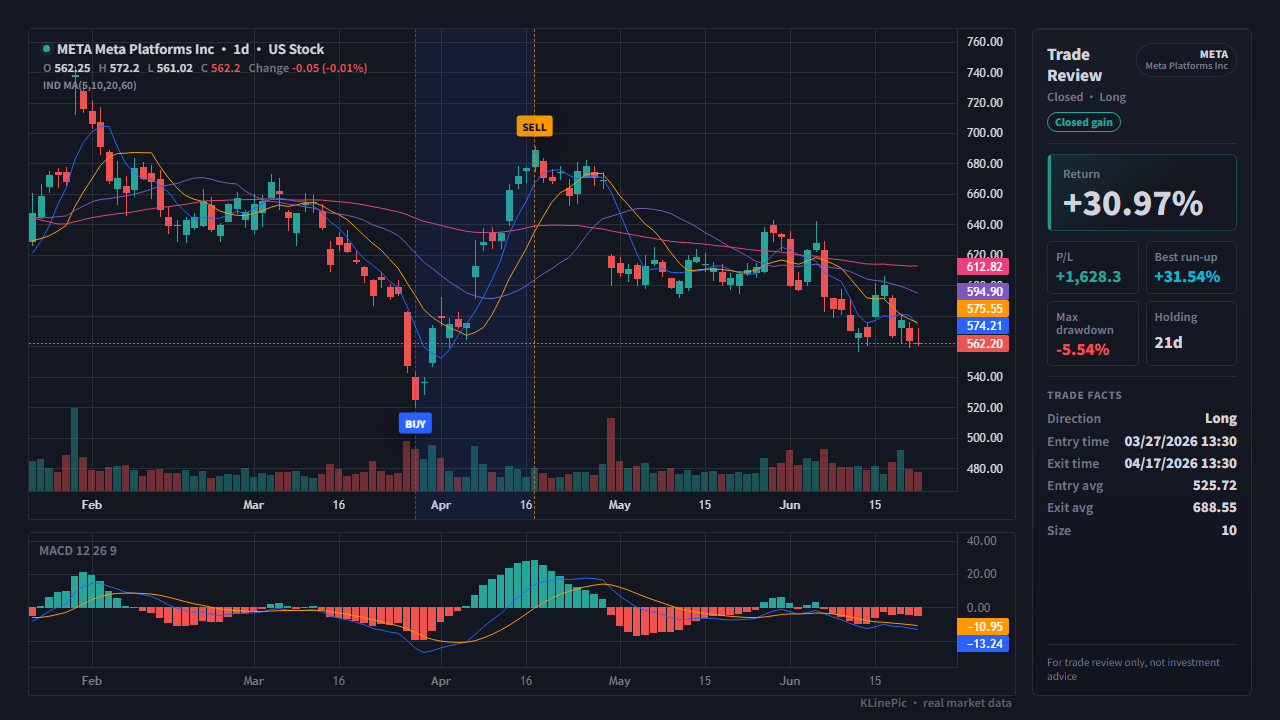
E*TRADE documents a CSV export most explicitly for Power E*TRADE Pro. The official Power E*TRADE Pro tools page says the History tool downloads transaction history to an Excel .csv via the down-arrow icon in its upper right corner, filters by symbol and by transaction type (withdrawals, deposits, trades, or all), and offers preset ranges from today back to the last 30 days plus a custom Range option. E*TRADE publishes no equivalent page for the etrade.com website, so the website steps below are the reliable pattern, not pixel-exact menus.
Log in, open Accounts, and open the transactions view for the account you traded in. Set a date range covering the whole trade, then use the download control near the table.
Add the History tool to a workspace, select the down-arrow icon in its upper right corner, enter a file name, and save the .csv.
Documented filters include transaction type — withdrawals, deposits, trades, or all — plus a symbol box. Filtering to trades skips cash rows you do not need.
Remove the account number and personal identifiers before uploading. A review chart only needs symbol, side, time, price, and quantity.
E*TRADE does not publish a fixed layout for the downloaded file — so treat this table as a checklist of what to look for, not literal header names. Every brokerage export carries a date, a symbol, a direction, a quantity, and a price — all a review chart needs.
| KLinePic field | From your E*TRADE export | Notes |
|---|---|---|
| trade_id | Not in the export — assign your own | One label per round trip (for example ET-META-01) groups partial fills onto a single chart. |
| symbol | The symbol / ticker column | Plain US tickers such as META work best; option and fund rows do not map to stock candles. |
| event_type | The transaction-type / direction column | Map purchase rows (often worded Bought) to buy and sales (Sold) to sell; drop dividends and cash rows. |
| position_side | Not present in a cash-equity export | Use long for ordinary stock trades; the field mainly matters for hedged futures. |
| time | The transaction / trade date column | ISO 8601 datetime with a UTC offset, e.g. 2026-07-01T09:45:00-04:00 — US sessions run on Eastern Time. For a date-only export, append a session time such as T09:30:00-04:00. |
| price | The price column | Per-share fill price, not the signed total dollar amount of the order. |
| quantity | The quantity / shares column | Number of shares; decimals are fine. Let event_type carry the side rather than negative signs. |
| fee | A commission or fees column, if present | Optional — leave 0 when no fee is listed. |
| note | Anything extra worth keeping | Optional free text — keep details like the fee currency as note text, e.g. currency=USD. Any column beyond the documented set is rejected, so extras belong here, not in their own column. |
A complete round trip is just a few rows. Two fills sharing one trade_id fold into a single META review chart with entry and exit markers and the holding window between them:
trade_id,symbol,event_type,position_side,time,price,quantity,fee,note
ET-META-01,META,buy,long,2026-07-01T09:45:00-04:00,500.00,6,0,currency=USD
ET-META-01,META,sell,long,2026-07-03T15:30:00-04:00,520.00,6,0,currency=USD
Each time is a full ISO 8601 datetime with a UTC offset (-04:00 is US Eastern in summer) — a date-only export works once you append a session time, as in the rows above. The full field reference, including JSON input, lives in the CSV/JSON data protocol, and the US stock template is a ready-made file to edit in any spreadsheet.
Here is how the three common approaches compare:
| KLinePic | Manual screenshot + spreadsheet | Typical trading-journal SaaS | |
|---|---|---|---|
| Setup time | Minutes — upload or paste fills | Slow — capture, crop, and annotate every trade | Longer — sign-up plus import configuration |
| Account required | None needed to render a chart | No | Usually yes |
| Output | Annotated K-line review image with return, run-up, and drawdown | A static screenshot plus spreadsheet rows | Dashboards and aggregate statistics |
| Buy/sell markers on a real K-line | Yes — B/S markers placed from your actual fills | Only if you draw them yourself | Varies by product |
| Shareable image | Yes — the output is an image built for sharing | Yes, but assembled by hand each time | Varies; often lives behind a login |
| Cost to start | Free to start | Free, but costs time on every trade | Often subscription-based |
Preset ranges are short — in Power E*TRADE Pro, today to the last 30 days. If your entry is older, use the custom Range option so the file contains both entry and exit fills.
Dividend reinvestment rows look like small buys. Drop them so the entry marker reflects your actual decision, not an automatic reinvestment.
An order filled in pieces shows up as several rows. Give them all the same trade_id so they land on one chart as a single position.
Exports often carry a per-share price and a signed total amount. KLinePic expects the per-share fill price — not price × quantity.
Option rows describe a contract and fund rows price once a day; neither maps onto stock candles. Keep to bare equity tickers like META.
On etrade.com, open Accounts, go to the transactions view, set a date range covering your trades, and use the download control near the table. In Power E*TRADE Pro, use the documented History tool: the down-arrow icon in its upper right corner, then name the file and save the Excel .csv.
Map them onto event_type: purchase rows become buy, sale rows become sell. The chart only needs to know which fills opened the position and which closed it.
Almost — the time field needs a full ISO 8601 datetime with a UTC offset, so append a session time to the date, for example turning 2026-07-01 into 2026-07-01T09:30:00-04:00. On a daily review chart the marker lands on that trading day, so the exact time you pick barely matters; a real intraday fill time only becomes important on intraday charts.
No. KLinePic reads only the CSV you upload or paste — no brokerage login or account linking. The chart only needs symbol, side, time, price, and quantity, so you can delete account numbers first.
KLinePic is free to start, and no account is required to render a trade review chart. Watermark-free high-resolution export is available as a paid option.
Yes. Batch rendering is supported, with a documented Agent API — see the guide at klinepic.com/guides/trade-review-chart-api/ and the data protocol at klinepic.com/docs.