Where to look
Log in, open the account you traded in, and go to its activity or history view. Set a date range, then use the download control by the table.
Fidelity trade history chart
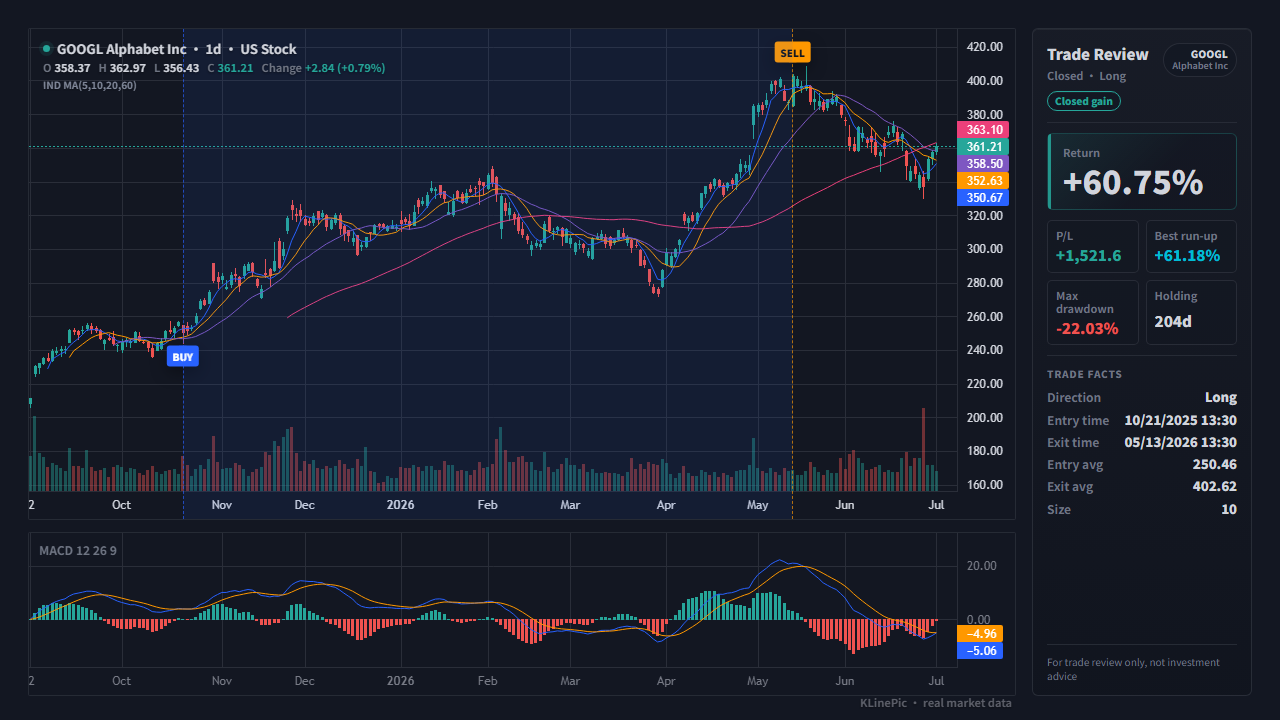
This guide is for Fidelity stock traders who want to review trades on a real chart instead of a table of fills. Download your transaction history, reshape the fill rows into a small CSV, and KLinePic renders an annotated K-line image with buy/sell markers, holding window, return, and drawdown — even from a date-only export.
Fidelity's help page for the account History tool documents the essentials of downloading transaction history: the tool searches approximately 5 years of transaction data and filters by date, transaction type (purchases, sales, money movement, dividends, and interest), and symbol or CUSIP. Fidelity does not publish a fixed layout for the download and relabels its navigation over time, so the steps below describe the pattern, not pixel-exact menus.
Log in, open the account you traded in, and go to its activity or history view. Set a date range, then use the download control by the table.
Per Fidelity's help, the History tool covers roughly 5 years. Copy older fills from the relevant account statement.
Use the transaction type filter to keep just purchases and sales — a smaller file with none of the rows you would drop anyway.
Remove the account number and personal identifiers before uploading anywhere. A review chart only needs symbol, side, time, price, and quantity.
Fidelity's public help pages do not document the download's exact column headers, and layouts can change — so treat the table below as a checklist of what to look for rather than literal header names. A date, a symbol, a side, a quantity, and a price are all a review chart needs.
| KLinePic field | From your Fidelity export | Notes |
|---|---|---|
| trade_id | Not in the export — assign your own | Use one label per round trip (for example FID-GOOGL-01) so partial fills group onto a single chart. |
| symbol | The symbol / ticker column | Plain US tickers such as GOOGL or AAPL. Mutual-fund and option rows do not map to stock candles — leave them out. |
| event_type | The action / transaction-type column | Map purchase rows to buy and sale rows to sell; drop dividends, reinvestments, and money movement. |
| position_side | Not present in a cash-equity export | Use long for ordinary Fidelity stock trades; the field mainly matters for hedged futures. |
| time | The run / trade date column | ISO 8601 datetime with a UTC offset, e.g. 2026-07-01T09:45:00-04:00 — US sessions run on US Eastern Time. For a date-only export, append a session time such as T09:30:00-04:00. |
| price | The price column | Per-share fill price, not the total dollar amount of the order. |
| quantity | The quantity / shares column | Number of shares; decimals are fine — event_type carries the side, not a negative sign. |
| fee | A commission or fees column, if present | Optional — leave it at 0 when no explicit fee is listed. |
| note | Anything extra you want to keep | Optional free text. Extra columns are ignored on import and listed back to you. Put context such as fee currency here as note text (for example currency=USD) only when you want it preserved. |
A complete round trip is just a few rows. Two fills sharing one trade_id fold into one GOOGL review chart with entry and exit markers and the holding window between them:
trade_id,symbol,event_type,position_side,time,price,quantity,fee,note
FID-GOOGL-01,GOOGL,buy,long,2026-07-01T09:45:00-04:00,175.00,8,0,currency=USD
FID-GOOGL-01,GOOGL,sell,long,2026-07-03T15:30:00-04:00,182.00,8,0,currency=USD
Each time is a full ISO 8601 datetime with a UTC offset (-04:00 is US Eastern in summer) — for a date-only Fidelity export, append a session time as in the rows above. The full field reference, including JSON input for automation, lives in the CSV/JSON data protocol, and the US stock template is a ready-made starting file.
Three common ways to review Fidelity fills, compared on the job that matters here: a marked-up chart of a single trade.
| KLinePic | Manual screenshot + spreadsheet | Typical trading-journal SaaS | |
|---|---|---|---|
| Setup time | Minutes — upload or paste fills | Slow — crop and annotate by hand for every trade | Longer — sign-up plus import setup |
| Account required | No — render without an account | No | Usually yes |
| Output | Annotated K-line review image with return, run-up, and drawdown | A static screenshot plus separate spreadsheet rows | Dashboards and aggregate statistics |
| Buy/sell markers on a real K-line | Yes — B/S markers placed from your actual fills | Only if you draw them yourself | Varies by product |
| Shareable image | Yes — the output is a share-ready image | Yes, but assembled by hand each time | Varies; often behind a login |
| Cost to start | Free to start | Free, but costs time on every trade | Often subscription-based |
Dividend reinvestment rows look like small buys. Drop them so the entry marker reflects your decision, not an automatic reinvestment.
An order filled in several pieces shows up as several rows. Give them all the same trade_id so they land on one chart as a single position.
US equity sessions run on US Eastern Time. Date-only values are safe; if you add clock times, include the UTC offset so markers hit the right candle.
Fund rows price once a day and option rows describe a contract, so neither maps onto stock candles — keep the chart to bare equity tickers like GOOGL.
Log in to fidelity.com, open the account you traded in, go to its activity or history view, set a date range, and use the download control near the history table. The labels shift over time, but the pattern — account, history, date range, download — stays the same.
Fidelity's help page for its account History tool says it searches approximately 5 years of transaction data and points to account statements for anything older. Beyond that window, copy the fills from the statement for that period by hand.
Yes. When a row only has a date, KLinePic places the marker on that trading day, using file order to keep buys ahead of sells. An intraday time only matters for intraday alignment.
No. The review chart is drawn from buy and sell events only. Keep just the fill rows for the symbol you are reviewing and drop dividends, reinvestments, interest, and cash movements.
No. KLinePic reads only the CSV you upload or paste — no brokerage login, no account linking. Delete account numbers first if you like; the chart only needs symbol, side, time, price, and quantity.
KLinePic is free to start, and no account is required to render a trade review chart. Watermark-free high-resolution export is available as a paid option.