Desktop platform
Open the History tab and click Transactions at the top of the window. Pick your account with the Account Filter and set a start and end date.
Tastytrade trade history chart
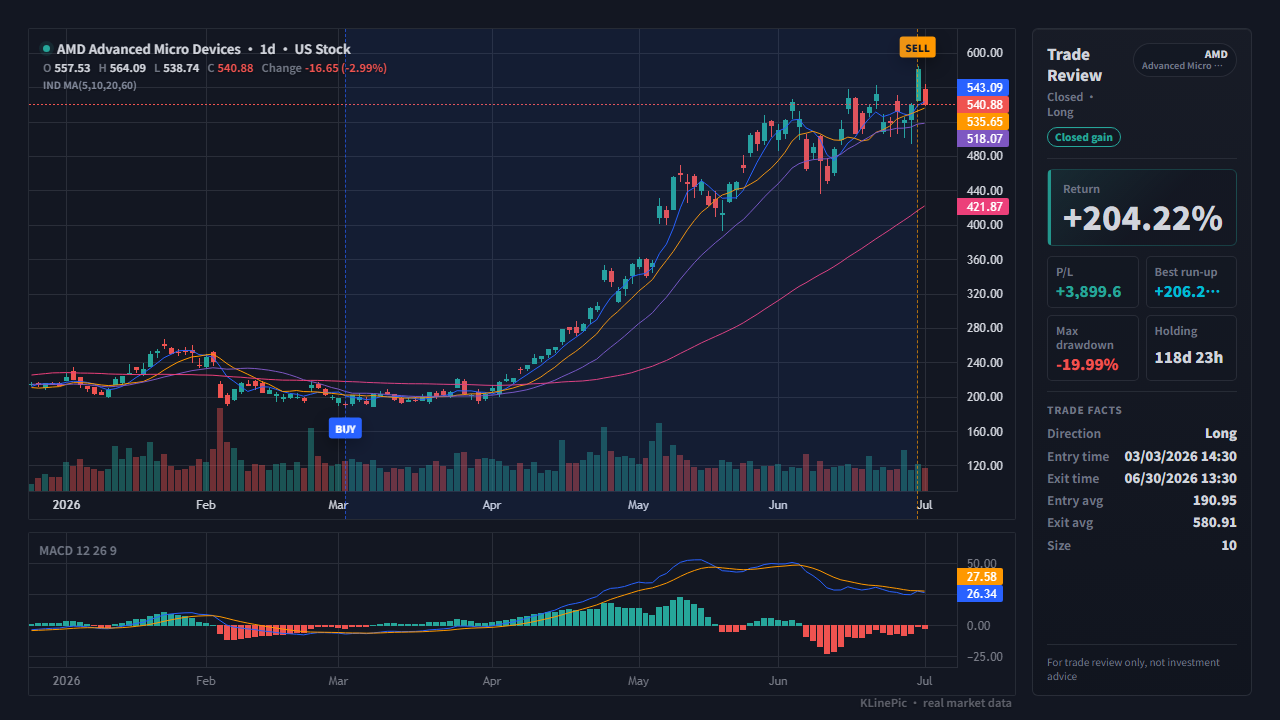
This guide is for tastytrade (formerly tastyworks) traders who want each round trip drawn on real candles instead of rows in a spreadsheet. Export your transactions, map the fills to a small CSV, and KLinePic renders a review image with buy/sell markers, holding window, return, max run-up, and max drawdown — no account required to start.
The steps below follow tastytrade's official help article, Export Transaction Data to a Spreadsheet (CSV File). One official caveat up front: the platform export also includes unrealized (still-open) positions.
Open the History tab and click Transactions at the top of the window. Pick your account with the Account Filter and set a start and end date.
After signing in, open History from the left-side navigation. Filter by account, symbol, asset, type, and date range, then click the CSV icon to save the export.
The platform populates about 1,000 lines at a time. Scroll until every transaction is on screen before exporting — unpopulated rows may be missing from the download.
Remove your account number and any personal identifiers before uploading anywhere. A review chart only needs symbol, side, time, price, and quantity.
tastytrade's ledger is unusually explicit about direction. Its official account transactions documentation lists six action values — Buy, Buy to Close, Buy to Open, Sell, Sell to Close, Sell to Open — and records execution timestamps in UTC. The History CSV's exact column headers appear only as a screenshot in the help article, so map by what each column contains; every export of executions carries a symbol, an action, a quantity, a price, and an execution date or time. The full specification is in the data protocol.
| Typical column in your export | KLinePic field | Notes |
|---|---|---|
| Order or fill identifier | trade_id |
Reuse one ID for every fill of the same round trip; a hand-made ID like TT-AMD-01 works fine. |
| Ticker symbol | symbol |
Plain ticker such as AMD; drop any description column and any option-contract strings. |
| Action (Buy to Open, Sell to Close, …) | event_type |
Any buy action becomes lowercase buy; any sell action becomes sell — whether your file spells it Buy to Open or BUY_TO_OPEN. |
| Action (the open/close half) | position_side |
Buy to Open and Sell to Close are a long trade; Sell to Open and Buy to Close are a short trade. |
| Execution date / time | time |
ISO 8601 with an explicit offset, e.g. 2026-07-01T09:40:00-04:00. tastytrade records executions in UTC, so mind the offset; a date-only value still works on daily candles. |
| Fill / average price | price |
The price the order actually executed at — not the limit price you placed. |
| Quantity | quantity |
Shares actually executed, as a positive number; the side lives in event_type, not in a sign. |
| Commissions & fees | fee |
Optional — sum commissions and fees per fill, or use 0 if you do not track them. |
| Fee currency | note |
There is no fee-currency field. Unrecognized columns are ignored on import and listed back to you; if you want to preserve the currency, write it into the free-text note column as something like currency=USD. |
One row per fill, one shared trade_id per round trip. A complete AMD swing trade is two rows:
trade_id,symbol,event_type,position_side,time,price,quantity,fee,note
TT-AMD-01,AMD,buy,long,2026-07-01T09:40:00-04:00,150.00,12,0,currency=USD
TT-AMD-01,AMD,sell,long,2026-07-03T15:50:00-04:00,160.00,12,0,currency=USD
From these two rows KLinePic draws entry and exit markers on real AMD candles, shades the holding window, and computes return, max run-up, and max drawdown. Anything extra — a fee currency, a broker name, a lesson learned — belongs inside the free-text note column; columns outside the accepted set are rejected by the parser. The US stock CSV template is ready to edit.
How the common options compare for getting your tastytrade fills onto a real candlestick chart:
| KLinePic | Manual screenshot + spreadsheet | Typical trading-journal SaaS | |
|---|---|---|---|
| Setup time | Minutes — upload or paste fills in the browser | Slow — recreate chart and annotations by hand per trade | Moderate — sign up, then import or sync broker data |
| Account required | No — render without an account | No | Usually yes |
| Output | Annotated K-line review chart with trade stats | Static screenshot plus separate spreadsheet rows | Dashboards and statistics; chart output varies |
| Buy/sell markers on real K-line | Yes — plotted from your actual fills | Only if you draw them yourself | Varies by product |
| Shareable image | Yes — the chart image is the primary output | Manual cropping and annotation each time | Usually screenshots of dashboards |
| Cost to start | Free to start; watermark-free hi-res export is paid | Free, but costs time on every single trade | Often subscription-based |
In tastytrade's ledger a reinvested dividend is recorded as a Buy to Open action under the Receive Deliver type. Filter the Type to Trade, or delete those rows, so phantom entries never reach the chart.
The platform populates about 1,000 lines at a time, and the official article warns that unpopulated line items may not appear in the file. Scroll until everything you filtered for is on screen before clicking the CSV icon.
tastytrade records executions in UTC, so a timestamp copied without its offset can land a marker on the wrong candle near the open or close. Write times as ISO 8601 with an explicit offset; date-only rows are fine on daily candles.
A 100-share order filled in three chunks is three rows. Give all three the same trade_id so they render as one trade instead of three fragments.
Equity-option and futures rows carry contract symbols that will not match US stock K-line data. For a stock review chart, keep Equity fills and use the plain ticker (AMD, AAPL).
tastytrade's article notes that if the downloaded file is not recognized by your computer, you should add a .csv extension to the filename — do that before uploading or opening it in a spreadsheet.
On the desktop platform, open the History tab, click Transactions at the top of the window, pick your account with the Account Filter, and set a date range. On the web platform, open History from the left-side navigation and use the same filters. Scroll until every row has populated — the platform loads about 1,000 lines at a time — then click the CSV icon to save the export. The steps are documented in tastytrade's official help article on exporting transaction data.
tastytrade's documented action values are Buy, Buy to Close, Buy to Open, Sell, Sell to Close, and Sell to Open. Map any buy action to event_type buy and any sell action to event_type sell. The open/close half tells you position_side: Buy to Open and Sell to Close belong to a long trade, while Sell to Open and Buy to Close belong to a short trade. The mapping is the same whether your file spells them Buy to Open or BUY_TO_OPEN.
Dividend reinvestments are recorded as Buy to Open actions under the Receive Deliver transaction type in tastytrade's ledger, so they look like entries. Filter the Type to Trade before exporting, or delete non-trade rows afterwards, so only real executions reach the review chart.
Give every fill of the same round trip the same trade_id — rows that share a trade_id are grouped into one trade, so a scaled entry or staged exit still renders as a single review chart.
Use ISO 8601 with an explicit UTC offset, such as 2026-07-01T09:40:00-04:00 for US Eastern in summer. tastytrade's API records execution timestamps in UTC (+00:00), so double-check the offset if you convert times by hand. A date-only value still works on daily candles.
US stock symbols are matched to US equity K-line data so entry and exit markers land on the correct candles.
No. KLinePic is free to start and does not require an account to render a trade review chart. Watermark-free high-resolution export is available as a paid option.
Yes. Batch rendering is supported, and a documented Agent API covers automated generation — see the guide at klinepic.com/guides/trade-review-chart-api/ and the data protocol at klinepic.com/docs.