Cents charted as dollars
A Kalshi review chart on a 0–100 scale instead of 0–1 is the telltale sign. Divide entry price, exit price, and both fee columns by 100 before mapping anything.
Kalshi & Polymarket historical data
Prediction-market history is scattered by design: your fills live in one place, the contract's price history in another, and neither venue hands you a tidy candle file. This guide maps where each dataset actually lives — Kalshi's per-year Documents CSV and public candlesticks endpoint, Polymarket's no-auth trades API and prices-history endpoint — and then walks the two files into a single annotated review chart with your entries and exits on the contract's real price path.
Everything below uses public, documented sources: no scraping, no browser extensions, and — for the market-data endpoints — no API keys.
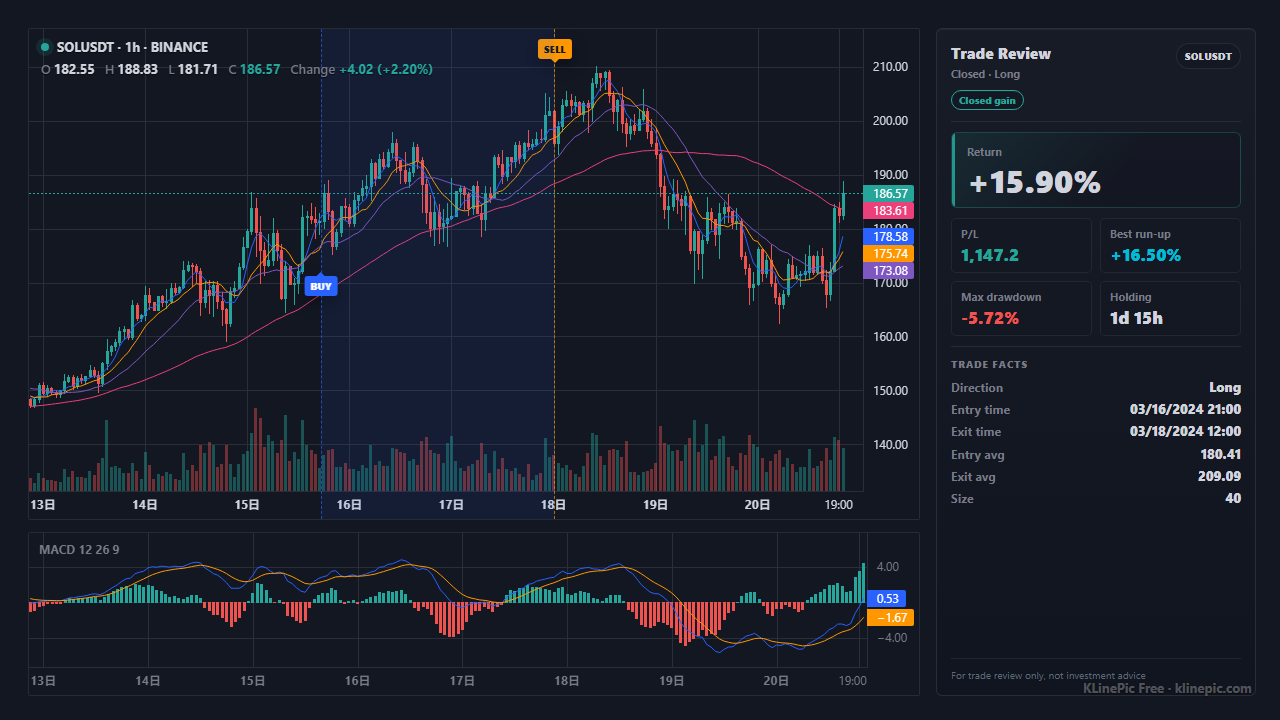
Four datasets cover nearly every "prediction market historical data" question. Two are about you, two are about the market:
| Dataset | Kalshi | Polymarket |
|---|---|---|
| Your trade history | Per-year CSV from Documents on the desktop site; monthly P&L under Account > Tax Info. Prices in whole cents. | No one-click CSV; public data API GET data-api.polymarket.com/trades?user=<wallet>, no auth, up to 10,000 rows per page. Prices in 0–1 dollars. |
| Your fills via API | GET /portfolio/fills on the trade API — authenticated, cursor-paged. |
The same public trades endpoint; fills carry the Polygon transaction hash for on-chain verification. |
| Market price history | No-auth candlesticks endpoint: dollar OHLC, volume, open interest at 1m / 1h / 1d. | No-auth prices-history endpoint: timestamp-price samples per token id, aggregated into candles by you. |
| Settlement record | Exit price of 0 or 100 cents in the CSV usually means the market resolved. | Resolution is on-chain; resolved markets may only return coarse price granularity. |
Your trades: log in at kalshi.com in a desktop browser (the mobile app does not expose exports), open the account menu, and go to Documents. Trading-history CSVs are provided per calendar year, so a multi-year account means multiple files; monthly-updated P&L statements (computed FIFO) live under Account > Tax Info. One conversion rule dominates everything downstream: Kalshi records prices and fees in whole cents — a 63-cent contract is stored as 63. Divide every price and fee column by 100 so contracts plot on the 0–1 dollar scale they settle on.
The market's history: Kalshi's public API documents a candlesticks endpoint that requires no authentication —
GET https://api.elections.kalshi.com/trade-api/v2/series/{series_ticker}/markets/{ticker}/candlesticks?period_interval=1440
Each candlestick carries trade-price open/high/low/close in dollars, volume, and open interest, at 1-minute (1), 1-hour (60), or 1-day (1440) periods. That response is already candle-shaped — for many markets it is the easiest historical dataset in this whole guide. Developers who want fills programmatically can use the authenticated GET /portfolio/fills instead of the Documents CSV.
Your trades: as of mid-2026 the main Polymarket site has no one-click CSV button, but your fills are public on-chain data, and the official data API serves them without authentication:
GET https://data-api.polymarket.com/trades?user={your wallet address}
The response lists every fill with side, outcome, price (0–1 dollars), size, timestamp, and the Polygon transaction hash, filterable by market and time, up to 10,000 rows per page. Third-party exporters wrap the same data as ready-made CSVs; the API is the primary source they all read.
The market's history comes from the public prices-history endpoint, queried by the market's token id (not its URL slug):
GET https://clob.polymarket.com/prices-history?market={token_id}&interval=1w&fidelity=60
Unlike Kalshi's endpoint this returns timestamp-and-price samples, not candles — you bucket them yourself (first sample per bucket as open, last as close, max/min as high/low). Two caveats: resolved markets may only return coarse granularity, and a market has separate tokens for its outcomes, so make sure the token id matches the side you actually traded.
Prediction-market tickers are not in KLinePic's built-in market data, so the chart is built from two files you control — which is also what makes it exactly reproducible. First the trades, in the schema from the data protocol (start from the prediction market template):
trade_id,symbol,event_type,position_side,time,price,quantity,fee,note
KX-FED-001,FED-25DEC-YES,buy,long,2026-06-03T14:20:00+00:00,0.42,200,0.14,entry on CPI print
KX-FED-001,FED-25DEC-YES,sell,long,2026-06-24T18:05:00+00:00,0.71,200,0.21,exit before meeting
Then the candles, converted from the venue's price history into the candle CSV:
symbol,time,open,high,low,close,volume
FED-25DEC-YES,2026-06-03T00:00:00+00:00,0.40,0.45,0.38,0.44,15200
FED-25DEC-YES,2026-06-04T00:00:00+00:00,0.44,0.47,0.41,0.46,9800
Three rules make the join work: prices in both files on the same 0–1 dollar scale, timestamps in both files with explicit UTC offsets, and the symbol spelled identically in both — it is the join key, and any ticker string works as long as it matches. Upload both files at /upload and the chart renders with B/S markers on the contract's price path, holding window, return, and drawdown; no account is required. The per-venue guides go deeper on export quirks: Kalshi trade history chart and Polymarket trade history chart.
GET /trade-api/v2/series/{series_ticker}/markets/{ticker}/candlesticks) with dollar OHLC, volume, and open interest at 1m/1h/1d periods; fills are available via the authenticated GET /portfolio/fills.GET https://data-api.polymarket.com/trades?user=<wallet>, no auth, up to 10,000 rows per page) returns per-fill side, outcome, 0–1 dollar price, size, timestamp, and Polygon transaction hash.symbol,time,open,high,low,close,volume) — since prediction tickers are not in built-in market data.A Kalshi review chart on a 0–100 scale instead of 0–1 is the telltale sign. Divide entry price, exit price, and both fee columns by 100 before mapping anything.
Trades in cents with candles in dollars (or vice versa) puts every marker a hundred times off the price path. Normalize both files to 0–1 dollars first, then convert.
Polymarket's prices-history endpoint wants the outcome token's id, not the URL slug — and each outcome has its own token. History that looks inverted usually means you queried the other side of the market.
A Kalshi exit at exactly 0 or 100 cents usually means the market resolved, not that you sold. Chart it the same way, but label it in note so the review distinguishes closed trades from held-to-settlement ones.
Polymarket returns price samples, not candles. Feeding raw samples into a candle chart produces one-tick bars; bucket them per interval — first as open, last as close, extremes as high/low.
The trade CSV and candle CSV are joined on symbol. One file saying FED-25DEC-YES and the other FED25DEC-YES means no markers render — pick one spelling and use it in both.
Log in at kalshi.com in a desktop browser, open the account menu, and go to Documents. Kalshi provides trading-history CSVs per calendar year; monthly P&L statements live under Account and Tax Info. The export is not available in the mobile app. Prices and fees in the CSV are whole cents — divide by 100.
Yes. Kalshi documents a no-auth candlesticks endpoint — GET /trade-api/v2/series/{series_ticker}/markets/{ticker}/candlesticks on api.elections.kalshi.com — returning dollar OHLC trade prices, volume, and open interest at 1-minute, 1-hour, or 1-day periods.
As of mid-2026 the main Polymarket site has no one-click CSV button, but fills are public on-chain data. GET https://data-api.polymarket.com/trades?user=<your wallet address> needs no authentication and returns every fill with side, outcome, price, size, timestamp, and Polygon transaction hash, up to 10,000 rows per page.
From the public prices-history endpoint on clob.polymarket.com, queried by the market's token id with an interval and fidelity. It returns timestamp-and-price samples that you aggregate into candles yourself; resolved markets may only return coarse granularity.
It differs by venue, which is exactly the trap: Kalshi exports record whole cents (63 means $0.63) while Polymarket's API returns 0–1 dollar prices (0.63 means the same thing). Normalize everything to the 0–1 dollar scale before charting so contracts that settle at $1 plot correctly.
Yes. Prediction market tickers are not in KLinePic's built-in market data, so upload two files: your trades in the trade CSV, and the contract's price history converted into the candle CSV (symbol,time,open,high,low,close,volume), with the symbol spelled identically in both.