Documents download
Log in at kalshi.com in a browser, open the account menu, and go to Documents. Download the trading-history CSV for each calendar year you traded. The mobile app does not expose this export.
Kalshi trade history chart
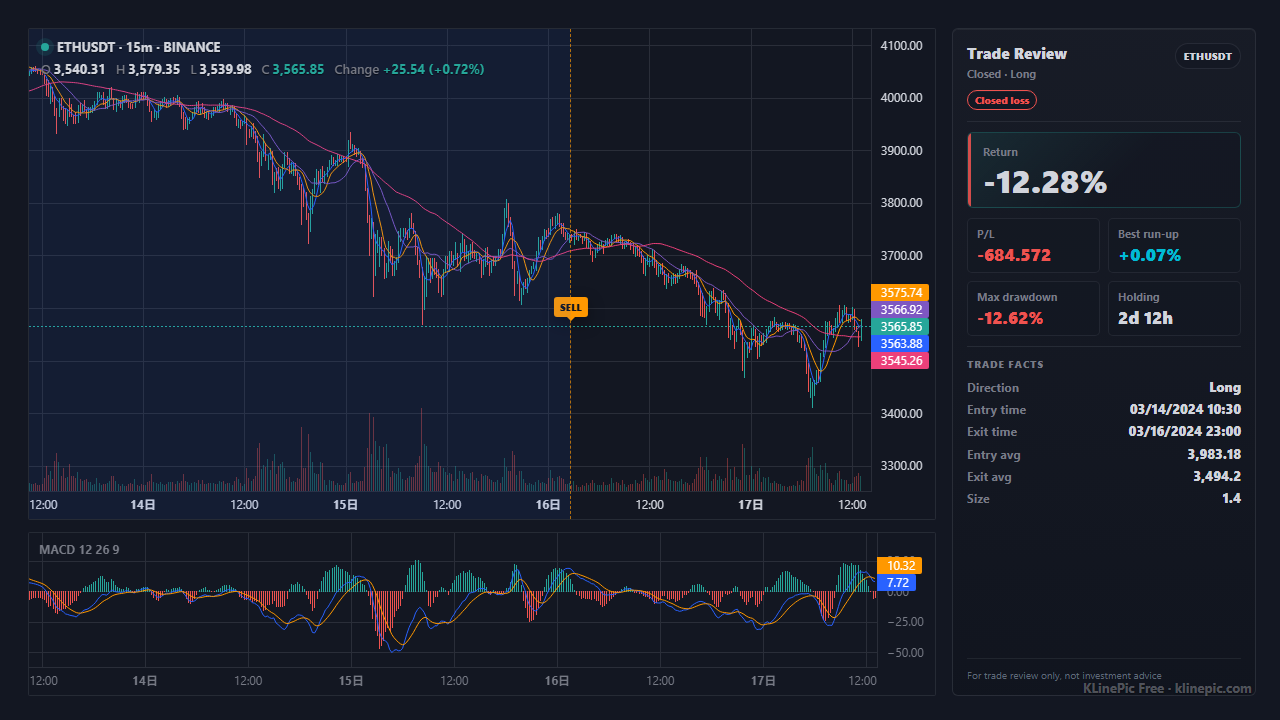
For Kalshi traders who want each position drawn on the contract's real price path instead of a portfolio screenshot. Download the per-year trading-history CSV, convert cents to dollars, map it to a small CSV, and KLinePic renders a review image with buy/sell markers, holding window, return, and drawdown — no manual charting, no account required to start.
Kalshi keeps account records in the desktop site rather than the mobile app. Its help center documents a Trading History area with total profit-and-loss summaries and statements, and a Tax Documentation page describing downloads under Account > Tax Info, with P&L data updated monthly and computed FIFO. Trading-history CSVs are provided per calendar year, so a multi-year account means multiple files.
Log in at kalshi.com in a browser, open the account menu, and go to Documents. Download the trading-history CSV for each calendar year you traded. The mobile app does not expose this export.
Under Account > Tax Info, pick a year and download the P&L statement. Kalshi states P&L is computed FIFO and refreshed monthly — useful for cross-checking the totals your chart set implies.
Developers can pull fills from GET /portfolio/fills on Kalshi's trade API (official reference) — authenticated, cursor-paged, with per-fill price, side, and timestamps.
Remove account identifiers before uploading anywhere. A review chart only needs market ticker, side, time, price, and quantity.
Kalshi's help center does not publish the export's exact column layout, and the format has changed over time — recent files pair each position into a single row with open and close columns, while older files are one row per fill. Work from what the columns contain and check your own download. Two rules drive the whole mapping: divide cent columns by 100, and split each paired row into two KLinePic rows (a buy and a sell) sharing one trade_id. The full field reference is the data protocol.
| Typical column in your export | KLinePic field | Notes |
|---|---|---|
Market ticker (e.g. market_ticker / Ticker) |
symbol |
Use the ticker exactly as it appears; your candle CSV must spell it the same way. |
| Open row / close row of a paired position | event_type |
The open becomes buy, the close becomes sell — two rows, one shared trade_id. |
Side (yes / no) |
position_side |
Charting against the Yes price: Yes positions are long, No positions are short. Keep the raw side in note. |
open_timestamp / close_timestamp |
time |
ISO 8601 with an explicit offset; one timestamp per row. |
entry_price_cents / exit_price_cents |
price |
Divide by 100: 63 cents becomes 0.63. An exit of 0 or 100 usually means the market settled rather than a market close. |
Contracts / quantity |
quantity |
Number of contracts, as a positive number. |
open_fees_cents / close_fees_cents |
fee |
Also cents — divide by 100 and put each leg's fee on its own row; 0 if untracked. |
| Realized P&L columns | note |
Not a KLinePic column — keep it as note text like pnl_with_fees=23.30. Extra columns are ignored on import, and the importer lists which ones it skipped. |
Older legacy exports (Ticker, Type, Direction, Contracts, Average_Price, Created) are already one row per event: keep rows where Type is trade, convert the Created time text into ISO 8601, and map Direction Yes/No the same way as above.
One row per fill, one shared trade_id per round trip, prices in dollars on the 0–1 contract scale. A complete Kalshi position is two rows:
trade_id,symbol,event_type,position_side,time,price,quantity,fee,note
KAL-FEDCUT-01,KXFEDCUT-26SEP,buy,long,2026-06-18T14:05:00-04:00,0.63,100,0.70,exchange=Kalshi side=yes
KAL-FEDCUT-01,KXFEDCUT-26SEP,sell,long,2026-07-02T10:40:00-04:00,0.86,100,0.70,exchange=Kalshi side=yes
From these two rows KLinePic draws entry and exit markers on the contract's candles, shades the holding window, and computes return, max run-up, and max drawdown. To start from a working file, the prediction market CSV template has this shape ready to edit.
Prediction market contracts are not in KLinePic's built-in market data, so bring the contract's price history as a custom K-line CSV. Kalshi makes this unusually easy: its public API documents a candlesticks endpoint that requires no authentication —
GET https://api.elections.kalshi.com/trade-api/v2/series/{series_ticker}/markets/{ticker}/candlesticks?period_interval=1440
Each candlestick carries trade-price open/high/low/close in dollars, volume, and open interest, at 1-minute (1), 1-hour (60), or 1-day (1440) periods, per the official reference. Convert the response into KLinePic's candle CSV — symbol,time,open,high,low,close,volume — with the same ticker spelling as your trade rows, and upload both files together.
For markets that track an external instrument (a BTC price threshold, a rate decision), an alternative view is to chart your entry and exit times against the underlying itself — for example on BTCUSDT candles, which KLinePic covers automatically. That view uses the underlying's prices, not your contract prices, so treat it as a timing review rather than a P&L review.
How the common options compare for reviewing Kalshi positions on a real price chart:
| KLinePic | Portfolio screenshot | Spreadsheet P&L tracker | |
|---|---|---|---|
| Shows the price path of the contract | Yes — candles plus your entry/exit markers | No — balance and position totals only | No — numbers without the chart |
| Setup time | Minutes — upload or paste fills | Instant but unreviewable | Manual formulas per market |
| Account required | No — render without an account | — | No |
| Timing review (was the entry early or late?) | Yes — markers sit on the candle they filled in | No | No |
| Shareable image | Yes — the image is the primary output | Crops of an account page | Screenshots of cells |
| Cost to start | Free to start; watermark-free hi-res export is paid | Free | Free, but costs time per market |
GET /series/{series_ticker}/markets/{ticker}/candlesticks) with dollar OHLC, volume, and 1m/1h/1d periods — enough to build the KLinePic candle CSV for any market you traded.Cent columns used as dollars. Divide entry_price_cents, exit_price_cents, and both fee columns by 100 — a review chart on a 0–100 scale instead of 0–1 is the telltale sign.
Recent Kalshi exports put the open and the close in a single row. Split it into a buy row and a sell row sharing one trade_id, or the chart has an entry with no exit.
An exit price of exactly 0 or 100 cents usually means the market resolved, not that you sold. Charting is the same, but label it in note so your review distinguishes closed trades from held-to-settlement ones.
Prediction market tickers are not in built-in market data — upload a candle CSV built from Kalshi's candlesticks endpoint, and spell the symbol in both files identically.
Against Yes-price candles, a No position profits when the price falls — that is a short. Mapping No to long draws profitable trades as losers.
Downloads are per calendar year. A trade opened in December and closed in January spans two files — download both years before pairing fills.
Log in to kalshi.com on the desktop site, open the account menu, and go to Documents. Kalshi provides trading-history downloads per calendar year, alongside monthly P&L statements under Account and Tax Info. The export is not available in the mobile app, so use a browser.
Kalshi records contract prices in whole cents: a 63-cent contract is stored as 63, not 0.63. Divide every price and fee column by 100 before charting so a contract that settles at $1 plots on a 0 to 1 dollar scale.
Kalshi's public API documents a no-auth candlesticks endpoint, GET /series/{series_ticker}/markets/{ticker}/candlesticks, with open, high, low, close trade prices in dollars, volume, and 1-minute, 1-hour, or 1-day periods. Convert that response into KLinePic's candle CSV (symbol,time,open,high,low,close,volume) and upload it alongside your trades.
Chart against the market's Yes price. A Yes position profits when the Yes price rises, so map it to position_side long; a No position profits when the Yes price falls, so map it to short. Keep event_type as the literal buy or sell action.
As of July 2026 Kalshi's help center lists 1099-INT, 1099-MISC, 1099-B for crypto transfers, and 1099-DA — none is a comprehensive statement of event-contract trading P&L. Kalshi provides P&L statements (computed FIFO) and per-year trading-history downloads as your records; how you report them is between you and your tax professional. This page is not tax advice.
No. KLinePic is free to start and needs no account to render a trade review chart. Watermark-free high-resolution export is a paid option.
Yes. Batch rendering is supported, and a documented Agent API covers automated chart generation. See the Agent API guide at klinepic.com/guides/trade-review-chart-api/ and the data protocol at klinepic.com/docs.