KKLinePic

Polymarket trade history chart

Turn your Polymarket trade history into a clean entry and exit review chart.

For Polymarket traders who want each position drawn on the market's real price path instead of a portfolio screenshot. Your fills are public on-chain data — pull them from the official data API, map them to a small CSV, and KLinePic renders a review image with buy/sell markers, holding window, return, and drawdown. No manual charting, no account required to start.

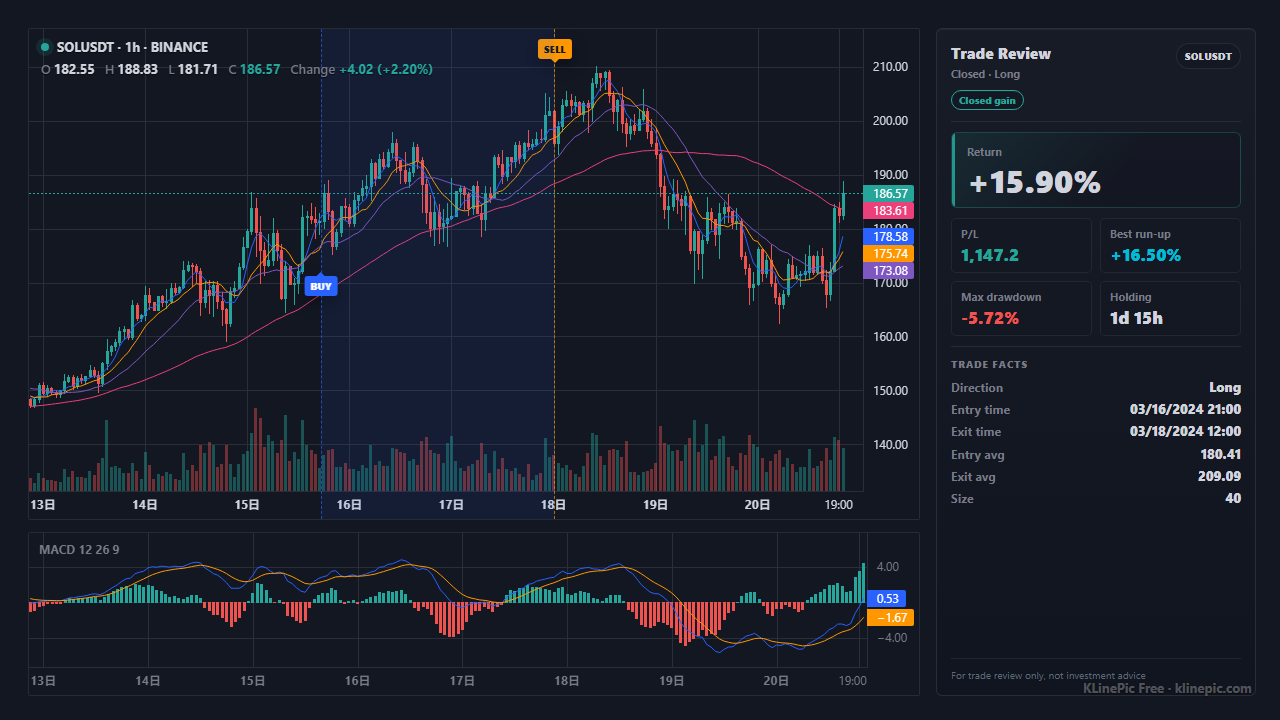
Trade review chart with buy and sell markers built from exported fills
Example output: a review chart with entry/exit markers, holding window, and a right-side trade summary.

Get your trade history out of Polymarket

As of July 2026 the main Polymarket site shows your history in the portfolio's Activity tab but has no one-click CSV button. The good news: every fill settles on Polygon, so your full history is public data with an official, no-auth API in front of it. The regulated Polymarket US exchange (a separate entity) additionally documents its own trades-CSV report endpoint for its account holders.

Official data API

GET https://data-api.polymarket.com/trades?user=<wallet> — no authentication, filterable by market and time, up to 10,000 rows per page, per the official reference. Each fill carries side, outcome, price, size, timestamp, and the Polygon transaction hash.

Activity feed API

The companion activity endpoint returns every account event — TRADE plus SPLIT, MERGE, REDEEM, rewards, deposits. Useful for a full ledger; only the TRADE rows become chart fills.

Third-party exporters

Community tools wrap the same public data into ready-made CSVs with year and market summaries. Convenient, but the columns vary by tool — the mapping below works from the official field names.

Privacy first

Your wallet address links all of this history together publicly. Before sharing a chart or file, strip addresses and transaction hashes you'd rather not publish — a review chart only needs market, side, time, price, and size.

Map Polymarket fills to KLinePic fields

The official /trades response is one row per fill — already the shape KLinePic wants. Prices are 0–1 dollar decimals (no cents conversion, unlike a Kalshi export); timestamps are Unix seconds and need converting to ISO 8601. The full field reference is the data protocol.

Data API field KLinePic field Notes
slug or title symbol Use the market slug as a compact symbol; your candle CSV must spell it identically.
side (BUY / SELL) event_type Lowercase to buy / sell.
outcome (Yes / No) position_side Charting against the Yes price: Yes positions are long, No positions are short. Keep the raw outcome in note.
timestamp (Unix seconds) time Convert to ISO 8601 with an explicit offset — on-chain times are UTC, so Z works.
price (0–1 decimal) price Already dollars per share — do not divide by 100.
size quantity Shares, as a positive number.
Fees fee The trades response has no per-fill fee field; some categories charge taker fees per the official fee page. Use 0 unless you track them separately.
transactionHash, conditionId note Not KLinePic columns — keep them as note text; the hash makes every fill independently verifiable on Polygon. Extra columns are ignored on import, and the importer lists which ones it skipped.

The CSV shape KLinePic reads

One row per fill, one shared trade_id per round trip, prices on the 0–1 dollar share scale. A complete Polymarket position is two rows:

trade_id,symbol,event_type,position_side,time,price,quantity,fee,note
PM-BTC120K-01,btc-120k-2026,buy,long,2026-06-21T09:12:00Z,0.41,250,0,exchange=Polymarket outcome=Yes
PM-BTC120K-01,btc-120k-2026,sell,long,2026-06-29T16:45:00Z,0.58,250,0,exchange=Polymarket outcome=Yes

From these two rows KLinePic draws entry and exit markers on the market's candles, shades the holding window, and computes return, max run-up, and max drawdown. To start from a working file, the prediction market CSV template has this shape ready to edit.
Getting candles for a Polymarket market

Prediction market tokens are not in KLinePic's built-in market data, so bring the market's price history as a custom K-line CSV. Polymarket documents a public price-history endpoint for traded market tokens:

GET https://clob.polymarket.com/prices-history?market={token_id}&interval=1w&fidelity=60

The response is a series of timestamp-and-price samples (t, p), per the official reference. Aggregate the samples into candles — group by hour or day, take the first/max/min/last price in each bucket — and write KLinePic's candle CSV: symbol,time,open,high,low,close,volume, with the same symbol spelling as your trade rows. Note that already-resolved markets may only return coarse granularity, so export price history while a market is still active if you want fine candles.

For markets that track an external instrument (a BTC price threshold, an ETF approval), an alternative view is to chart your entry and exit times against the underlying itself — for example on BTCUSDT candles, which KLinePic covers automatically. That view uses the underlying's prices, not your share prices, so treat it as a timing review rather than a P&L review.

Workflow

  1. Pull your trades from the public data API: GET https://data-api.polymarket.com/trades?user=<wallet address>, no authentication required. The response lists every fill with side, outcome, price, size, timestamp, and the Polygon transaction hash. Third-party exporters wrap the same data as ready-made CSVs.
  2. Map each fill to KLinePic fields: market slug as symbol, BUY/SELL as event_type, Yes outcomes as position_side long and No outcomes as short, the 0-1 dollar price as price, size as quantity, and the transaction hash in note. Convert Unix timestamps to ISO 8601.
  3. Drop non-trade activity. SPLIT, MERGE, REDEEM, and reward rows from the activity feed are not fills — keep only TRADE records.
  4. Attach candles for the market. Aggregate samples from the public prices-history endpoint into KLinePic's candle CSV (symbol,time,open,high,low,close,volume), or chart crypto-linked markets against the underlying instrument as a timing view.
  5. Upload trades plus candles, confirm the recognized symbol, side, and entry and exit times, then render and download the annotated review chart.

KLinePic vs the usual alternatives

How the common options compare for reviewing Polymarket positions on a real price chart:

KLinePic Portfolio screenshot P&L tracker site
Shows the price path of the market Yes — candles plus your entry/exit markers No — balance and position totals only Sometimes — totals first, charts vary
Timing review (was the entry early or late?) Yes — markers sit where they filled No Rarely
Works from official public data Yes — you export, you keep the file Yes, but hosted on their side
Account required No — render without an account Often wallet-connect or signup
Shareable image Yes — the image is the primary output Crops of an account page Dashboard screenshots
Cost to start Free to start; watermark-free hi-res export is paid Free Varies

Key facts

  • KLinePic (klinepic.com) turns real trade fills — uploaded or pasted as CSV — into a shareable annotated review chart; prediction market tokens use the custom K-line CSV path for candles.
  • Polymarket shares trade between $0.00 and $1.00; a winning share redeems for $1.00, a losing share for $0.00, with pUSD collateral, per Polymarket's own documentation.
  • As of July 2026 the main site has no one-click CSV export; the official no-auth data API (GET https://data-api.polymarket.com/trades?user=…) returns per-fill side, outcome, 0–1 dollar price, size, Unix timestamp, and Polygon transaction hash.
  • Every fill settles on Polygon, so each row of your history carries a transaction hash that anyone can verify on-chain — useful for honest, provable trade recaps.
  • A documented public price-history endpoint (clob.polymarket.com/prices-history) provides timestamp-and-price samples per market token, which aggregate into KLinePic's candle CSV (symbol,time,open,high,low,close,volume).
  • The global polymarket.com site does not issue tax forms for trading, so records are the trader's job — export the fills, keep the hashes, and consult a tax professional. Not tax advice.
  • The KLinePic CSV fields are: trade_id, symbol, event_type, position_side, time, price, quantity, plus optional name, fee, and note. Extra columns are ignored on import and listed back to you.
  • Free to start, no account required to render a trade review chart; watermark-free high-resolution export is a paid option. Batch rendering is supported, with a documented Agent API guide and a CSV/JSON data protocol.

Common mistakes and troubleshooting

Empty API response

Positions sit in a proxy wallet controlled by your signing wallet. The user parameter accepts either address — if one returns nothing, query the other (the proxy address is in your profile URL).

Dividing dollars by 100

Polymarket prices are already 0–1 decimals. The ÷100 step belongs to Kalshi's cent-based exports — applying it here shrinks every price to near zero.

Unix timestamps read as text

timestamp is Unix seconds. Convert to ISO 8601 (2026-06-21T09:12:00Z) before mapping, or every marker lands on the wrong candle — or nowhere.

SPLIT / MERGE / REDEEM rows charted as trades

The activity feed mixes fills with position mechanics and rewards. Only TRADE rows are fills; a REDEEM at $1.00 is settlement, not a sell you timed.

Yes/No mapped backwards

Against Yes-price candles, a No position profits when the price falls — that is a short. Mapping No to long draws profitable trades as losers.

Coarse candles for resolved markets

Price history for already-resolved markets may only come back at coarse granularity. Export while the market is active, or accept daily candles for old trades.

FAQ

How do I export my trade history from Polymarket?

As of July 2026 the main Polymarket site has no one-click CSV button. Your fills are public on-chain data, so use the official data API — GET https://data-api.polymarket.com/trades?user=<your wallet address>, no authentication required — or a third-party exporter that wraps the same data. The regulated Polymarket US exchange documents its own CSV report endpoint for its account holders.

Which wallet address do I query, my wallet or the proxy?

Polymarket positions sit in a proxy wallet controlled by your signing wallet. The data API's user parameter accepts either address, so if one returns nothing, try the other — the proxy address is shown in your Polymarket profile URL.

Are Polymarket prices in cents or dollars?

Dollars already. The data API returns price as a 0 to 1 decimal — 0.41 means 41 cents — so unlike a Kalshi export there is nothing to divide by 100. A winning share redeems for $1.00, a losing share for $0.00.

Where do candles for a Polymarket market come from?

Polymarket documents a public prices-history endpoint (clob.polymarket.com/prices-history) that returns timestamp-and-price samples for a market token. Aggregate those samples into candles and upload them as KLinePic's candle CSV (symbol,time,open,high,low,close,volume). Note that resolved markets may only return coarse granularity.

Does Polymarket send tax forms for my trading?

The global polymarket.com site does not issue tax forms, so record-keeping falls on the trader — that is exactly what the trade export and your on-chain transaction hashes are for. Rules differ by country and situation; this page is not tax advice, so check with a tax professional.

Do I need an account or a payment method to try this?

No. KLinePic is free to start and needs no account to render a trade review chart. Watermark-free high-resolution export is a paid option.

Can I render many Polymarket trades at once?

Yes. Batch rendering is supported, and a documented Agent API covers automated chart generation. See the Agent API guide at klinepic.com/guides/trade-review-chart-api/ and the data protocol at klinepic.com/docs.

Related guides