1 · Generate
Control Center > New > Trade Performance. Pick the account, set From/To, set the display unit to Currency, press Generate.
NinjaTrader trade history chart
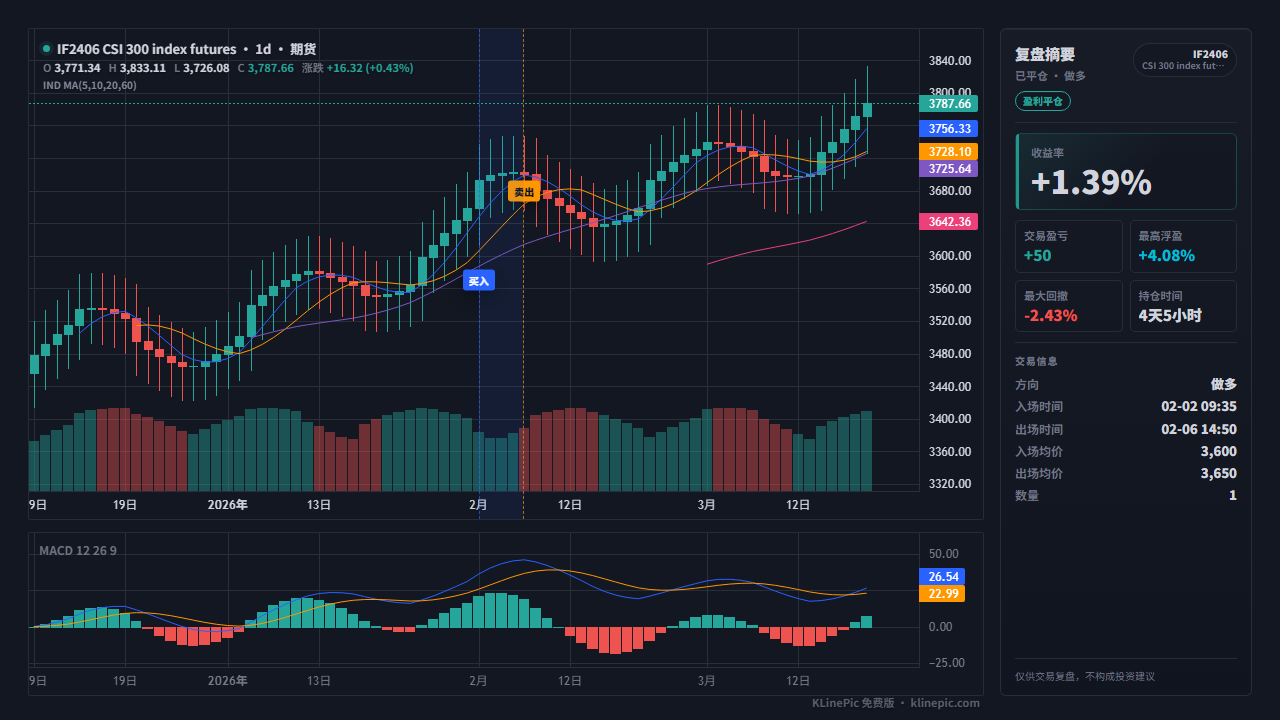
For NT8 futures traders — including funded evaluations that run on NinjaTrader — who want each round trip drawn on real candles instead of a P&L grid. Generate Trade Performance, export the Trades or Executions grid, map it to a small CSV, and KLinePic renders a review image with buy/sell markers, holding window, return, and drawdown. No manual charting, no account required to start.
NinjaTrader's official help guide documents the whole path: open Trade Performance from the Control Center (New > Trade Performance), select the account and date range, and press Generate. The report's display modes include Trades, Executions, Summary, and Analysis, and any data grid exports via right-click, per the Executions tab reference.
Control Center > New > Trade Performance. Pick the account, set From/To, set the display unit to Currency, press Generate.
Switch Display to Executions (one row per fill) or Trades (one row per paired round trip, with MAE/MFE).
Right-click the grid and choose Export..., format CSV. The file follows the grid's visible columns, so restore default columns if something is missing.
The NinjaTrader web platform (Tradovate technology) offers fill-level report downloads from the account area — or use the Tradovate Reports > Orders path.
From the Executions grid, each row is already one fill. NinjaTrader's documented columns include Instrument, Action (Buy/Sell), Quantity, Price, Time, E/X (Entry/Exit), Commission, and Position. The full KLinePic specification is in the data protocol.
| Executions column | KLinePic field | Notes |
|---|---|---|
| Instrument (e.g. NQ SEP26) | symbol |
Normalize to one spelling (e.g. NQU6) and keep it identical across trade rows and candle source. |
| Action (Buy / Sell) | event_type |
Lowercase buy or sell. |
| E/X + first fill of the trade | position_side |
A round trip whose entry is a buy is long; a sell-first entry is short. |
| Time | time |
Displayed in the platform's time-zone setting — rewrite as ISO 8601 with an explicit offset. |
| Price | price |
The executed price in index points. |
| Quantity | quantity |
Contracts filled, as a positive number. |
| Commission | fee |
Per-fill commission as exported; 0 if blank. |
| ID, Order ID, Name, Rate, … | note / drop |
Extra columns are ignored on import, and the importer lists which ones it skipped. |
From the Trades grid instead: each row pairs a whole round trip — Market position (Long/Short), Entry price, Exit price, Entry time, Exit time, Profit, Commission, MAE, MFE. Split every row into two KLinePic rows (a buy and a sell for longs; a sell then a buy for shorts) sharing one trade_id, and keep Profit/MAE/MFE in note if you want them in the review.
One row per fill, one shared trade_id per round trip. A short NQ round trip is two rows — sell first, then buy back:
trade_id,symbol,event_type,position_side,time,price,quantity,fee,note
NT8-NQ-01,NQU6,sell,short,2026-07-10T10:15:00-04:00,20510.25,1,2.09,platform=NinjaTrader
NT8-NQ-01,NQU6,buy,short,2026-07-10T11:02:00-04:00,20455.50,1,2.09,platform=NinjaTrader
From these two rows KLinePic draws entry and exit markers on real candles, shades the holding window, and computes return, max run-up, and max drawdown — direction-aware, so the short's profit reads correctly when price falls. The futures template shows the raw-statement variant of the same idea.
Month-letter CME contracts such as ES, NQ, and CL can match built-in candles automatically; see market data coverage. Micro contracts (MES, MNQ) track the identical index as their E-mini parents — chart them on the parent's candles or upload a custom candle CSV. Contract values for your notes: ES $50 per point, MES $5, NQ $20, MNQ $2, per CME's specs — the Tradovate guide carries the full tick-value table.
Two NT8-specific realities worth planning around: Trade Performance reads the machine's local database, so history from another PC or a reinstalled platform may be incomplete — export regularly, or fall back to your broker statements; and reports generate for one account at a time, so funded traders with multiple evaluations export per account.
How the common options compare for getting NT8 fills onto a real candlestick chart:
| KLinePic | NT8 built-in reports | Typical trading-journal SaaS | |
|---|---|---|---|
| Buy/sell markers on real candles | Yes — a shareable annotated chart per trade | Chart markers exist in-platform; reports are grids | Varies by product |
| Shareable image output | Yes — the image is the primary output | Screenshots of the platform | Usually dashboard screenshots |
| Works outside the trading PC | Yes — any browser, from the exported CSV | No — tied to the local install | Yes |
| Account required | No — render without an account | — | Usually yes |
| Cost to start | Free to start; watermark-free hi-res export is paid | Included with the platform | Often subscription-based |
If the Profit column looks tiny, the display unit was Points or Ticks. Regenerate with Currency — or ignore it: KLinePic computes return and drawdown from your prices.
Exported times follow the platform's time-zone setting, not the exchange. Write ISO 8601 with an explicit offset and spot-check one fill against the platform before rendering.
Export follows the grid's visible column setup. If Commission or Time is missing, restore the grid's default columns (right-click > Properties) and export again.
A Trades-grid row holds both the entry and the exit. Split it into two rows sharing one trade_id, or the chart shows an entry with no exit.
Trade Performance reads the local database, which fills while the platform is connected. For older history, re-import from broker statements or your journal's copy.
From Executions there is no long/short column — derive it from the round trip's first fill. Sell-first means position_side is short on every row of that trade.
Open the Control Center, choose New, then Trade Performance. Select the account, set the From and To dates, and press Generate. Switch the Display to Trades or Executions, then right-click the grid and choose Export... to save a CSV. Both steps are documented in NinjaTrader's official help guide.
Either works. Executions is one row per fill — Action (Buy/Sell), Quantity, Price, Time, Commission — which maps straight onto KLinePic rows. Trades is one row per paired round trip with Market position, entry and exit price and time, Profit, and Commission; split each row into a buy row and a sell row sharing one trade_id.
Trade Performance can display results in Currency, Percent, Points, Pips, or Ticks. Set the display unit to Currency before generating and exporting if you want dollar figures — KLinePic computes its own return and drawdown from your prices either way.
NinjaTrader displays times using the platform's time zone setting (Tools > Options), which typically follows your PC. Rewrite exported times as ISO 8601 with an explicit offset, and spot-check one fill against the platform before rendering.
Yes — the web platform (built on Tradovate technology) offers downloadable reports from the account area, including a fill-level report; accounts there can also use the Tradovate Reports > Orders path described in our Tradovate guide.
No. KLinePic is free to start and needs no account to render a trade review chart. Watermark-free high-resolution export is a paid option.
Yes. Batch rendering is supported, and a documented Agent API covers automated chart generation. See the Agent API guide at klinepic.com/guides/trade-review-chart-api/ and the data protocol at klinepic.com/docs.