Reports tab
In the platform, open the Reports tab, switch to the Orders view, and click Download CSV.
Tradovate trade history chart
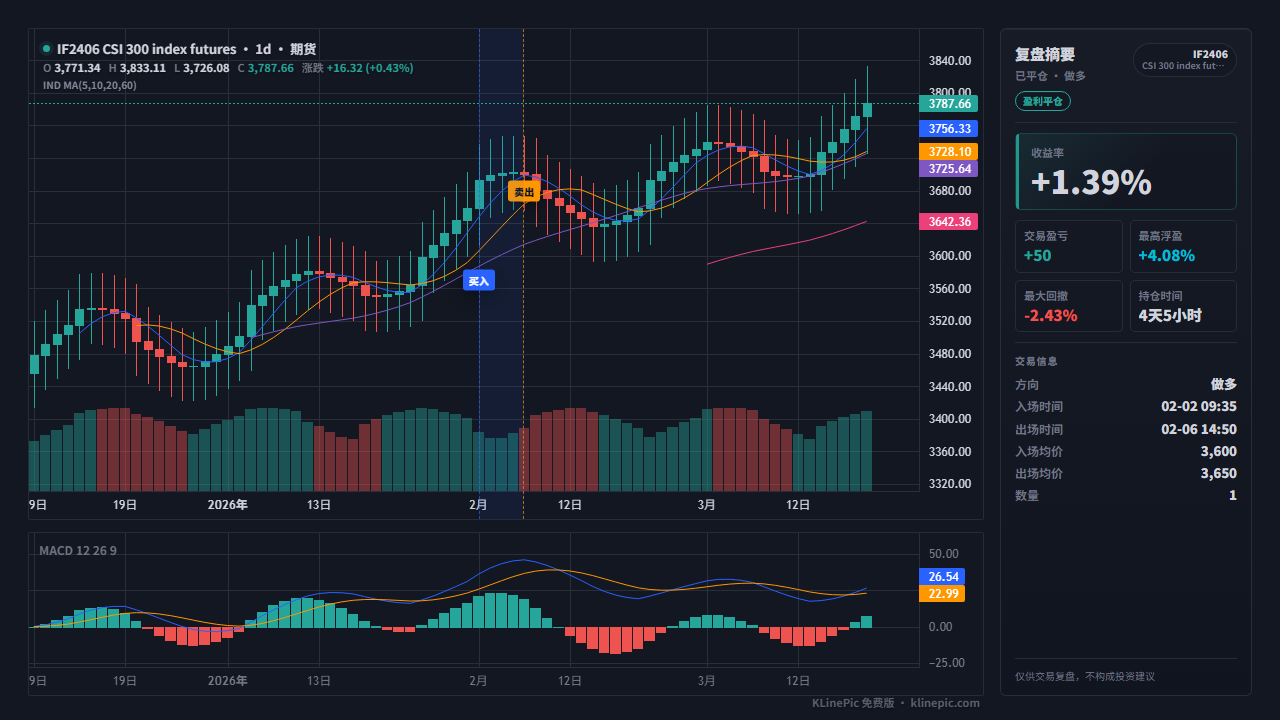
For futures traders — including Topstep, Apex, and MyFundedFutures accounts running on Tradovate — who want each round trip drawn on real candles instead of a P&L screenshot. Export the Orders report, map the fills to a small CSV, and KLinePic renders a review image with buy/sell markers, holding window, return, and drawdown. No manual charting, no account required to start.
Tradovate's help center documents running reports inside the platform and account reports; account statements are covered in a separate article. The report you want for charting is Orders — a fill-level ledger. Two routes reach it:
In the platform, open the Reports tab, switch to the Orders view, and click Download CSV.
Click your account name, open the gear icon, choose Account reports, pick the Orders tab (not Performance), set the date range, and download the report.
The Orders export has no commission column. Export the Cash History report for the same date range if you want fee totals alongside your fills.
Performance is a pre-paired trade summary whose layout varies between exports. Journal importers commonly reject it — the fill-level Orders report is the reliable source.
Much of the funded-futures world runs on Tradovate accounts. If your evaluation or funded login lives at trader.tradovate.com or topstep.tradovate.com, the Orders export above works unchanged:
Reviewing your evaluation trades on real candles — where exactly you entered relative to the move — is precisely what these accounts' consistency and drawdown rules reward.
Column names can vary slightly between Tradovate export versions; recent Orders CSVs carry both raw fields (avgPrice, filledQty) and display fields (Avg Fill Price, Filled Qty). Work from what the columns contain. The full specification is in the data protocol.
| Typical column in your export | KLinePic field | Notes |
|---|---|---|
Contract (e.g. MESU6) |
symbol |
Keep the month code; spell it the same as your candle source. Product (MES) plus month works too if consistent. |
B/S |
event_type |
Lowercase buy or sell. |
| Direction of the round trip | position_side |
Not a column — derive it: a round trip that opens with a buy is long, one that opens with a sell is short. |
Fill Time / Timestamp |
time |
Commonly exported in your local timezone — rewrite as ISO 8601 with the explicit offset, e.g. 2026-07-08T09:31:00-05:00. |
Avg Fill Price / avgPrice |
price |
The executed price in index points — not the limit price. |
Filled Qty / filledQty |
quantity |
Contracts filled, as a positive number. |
| Commission | fee |
Not in the Orders export — take totals from Cash History, or use 0. |
Status, order IDs, _tickSize, … |
note / drop |
Filter to Status = Filled first. Extra columns are ignored on import, and the importer lists which ones it skipped. |
One row per fill, one shared trade_id per round trip. A complete MES scalp is two rows:
trade_id,symbol,event_type,position_side,time,price,quantity,fee,note
TDV-MES-01,MESU6,buy,long,2026-07-08T09:31:00-05:00,5620.25,2,0,platform=Tradovate
TDV-MES-01,MESU6,sell,long,2026-07-08T14:45:00-05:00,5665.75,2,0,platform=Tradovate
From these two rows KLinePic draws entry and exit markers on real candles, shades the holding window, and computes return, max run-up, and max drawdown. The futures template shows the raw-statement variant of the same idea.
Month-letter CME contracts such as ES, NQ, and CL can match built-in candles automatically; see market data coverage. Micro contracts track the identical index as their E-mini parents, so you can chart MES fills on ES candles (the price levels are the same) or upload a custom candle CSV for the exact micro symbol. For context in your review notes, the CME-published contract values:
| Contract | Per index point | Minimum tick |
|---|---|---|
| ES — E-mini S&P 500 | $50 | 0.25 pt = $12.50 |
| MES — Micro E-mini S&P 500 | $5 | 0.25 pt = $1.25 |
| NQ — E-mini Nasdaq-100 | $20 | 0.25 pt = $5.00 |
| MNQ — Micro E-mini Nasdaq-100 | $2 | 0.25 pt = $0.50 |
Micros are one-tenth of their E-mini parent (see CME's micro contract specs). KLinePic's return and drawdown stats are computed on price, so they read the same for a micro and its parent — the dollar translation is yours to note.
How the common options compare for getting futures fills onto a real candlestick chart:
| KLinePic | Manual screenshot + spreadsheet | Typical trading-journal SaaS | |
|---|---|---|---|
| Setup time | Minutes — upload or paste fills | Slow — hand-drawn annotations per trade | Moderate — sign up and connect the account |
| Account required | No — render without an account | No | Usually yes |
| Long and short round trips | Yes — direction-aware markers and stats | Only if you draw them yourself | Yes |
| Buy/sell markers on real candles | Yes — plotted from your actual fills | Only if you draw them yourself | Varies by product |
| Shareable image | Yes — the image is the primary output | Manual cropping each time | Usually dashboard screenshots |
| Cost to start | Free to start; watermark-free hi-res export is paid | Free, but costs time per trade | Often subscription-based |
The Performance report is pre-paired and its layout varies. If your file has entry and exit columns on one row, re-export from the Orders tab — or split each row into two fills sharing a trade_id.
Local-time exports without an offset can shift markers a whole session. Write 2026-07-08T09:31:00-05:00, not 07/08/2026 09:31, and spot-check one fill against the platform.
The Orders ledger records every order state. Filter to filled rows first, or the chart shows entries that never happened.
MESU6 vs MES vs ES: pick one spelling that your candle source understands and use it consistently. Micros can ride their E-mini parent's candles — same index, same prices.
The export has no long/short column. Derive it from the round trip's first fill: sell-first means position_side is short on every row of that trade.
No commission column in Orders is normal. Pull totals from Cash History for the same range, or accept fee = 0 and read your stats as gross.
In the Tradovate platform, open the Reports tab, switch to the Orders view, and use Download CSV — Tradovate's help center documents running reports inside the platform. The same data is also reachable from your account menu under Account reports: pick the Orders tab, set the date range, and download.
Orders. The Orders report is a fill-level ledger with side, contract, filled quantity, average fill price, and fill time — exactly what a review chart needs. The Performance report is a pre-paired trade summary whose layout varies, and most journal importers reject it.
Exports commonly come out in your local timezone rather than exchange time or UTC. Write each fill time as ISO 8601 with an explicit offset (for example 2026-07-08T09:31:00-05:00 for US Central in summer) so markers land on the right candles.
Tradovate's Orders export is an order ledger without a commission column. Fees and commissions live in the separate Cash History report — export it for the same date range if you want per-day fee totals, or leave the KLinePic fee column at 0.
Yes, if your evaluation or funded account runs on Tradovate the export path is identical — log in to your funded login (for example trader.tradovate.com or topstep.tradovate.com) and use Reports > Orders. Accounts on other stacks (TopstepX, Rithmic, NinjaTrader desktop) export from those platforms instead.
No. KLinePic is free to start and needs no account to render a trade review chart. Watermark-free high-resolution export is a paid option.
Yes. Batch rendering is supported, and a documented Agent API covers automated chart generation. See the Agent API guide at klinepic.com/guides/trade-review-chart-api/ and the data protocol at klinepic.com/docs.